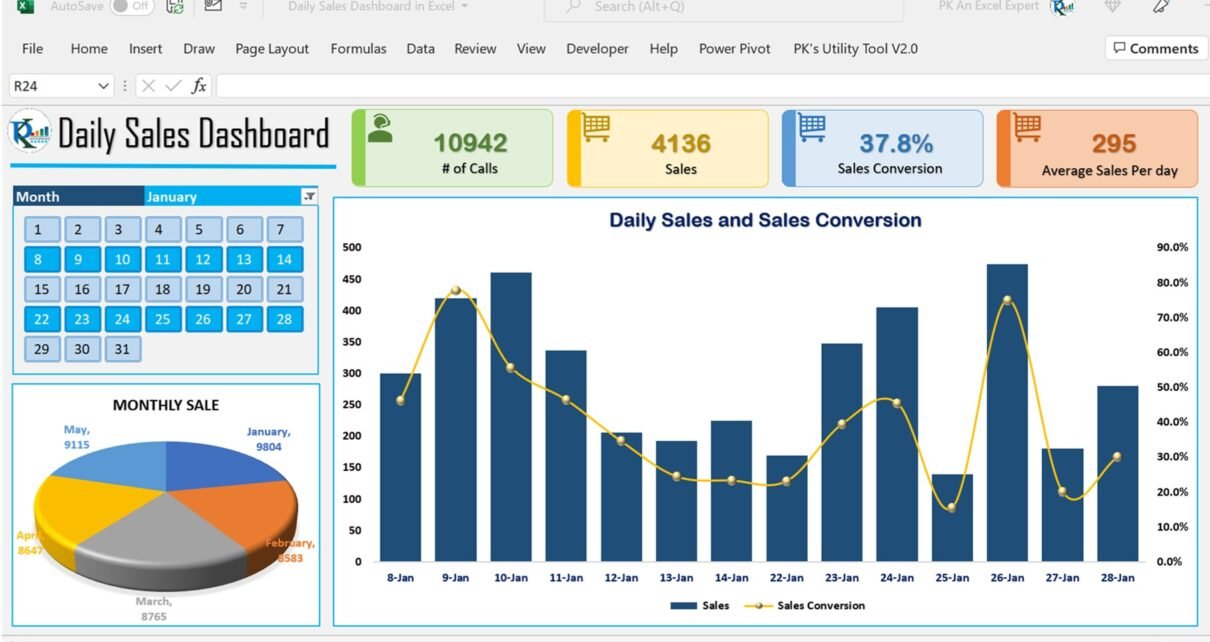
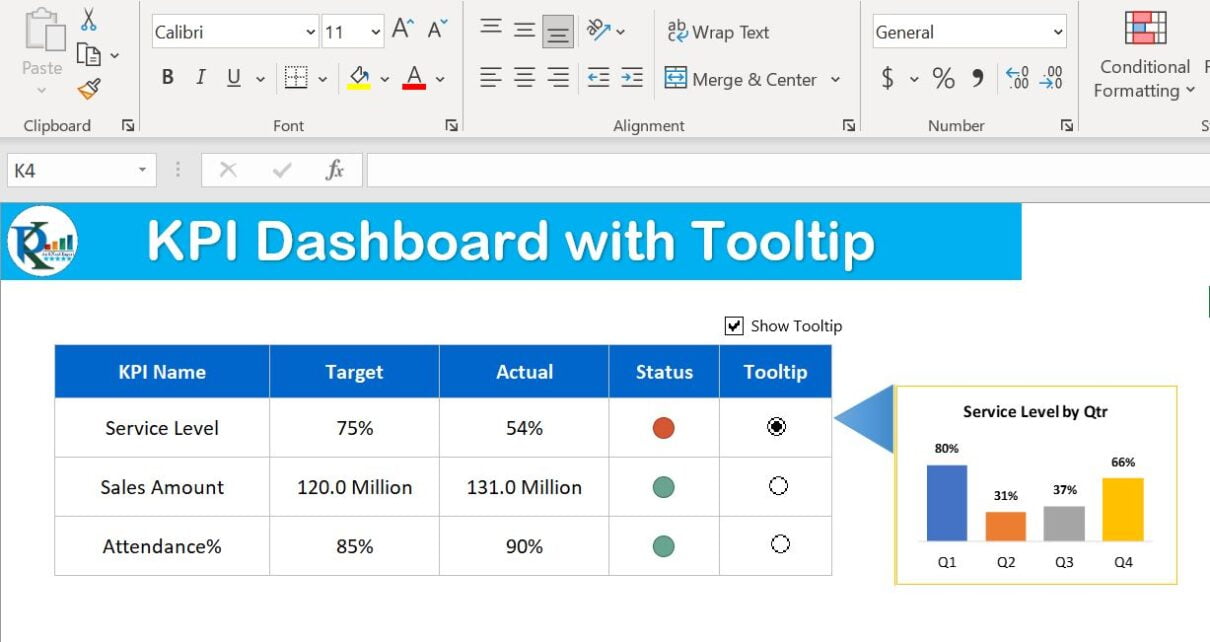
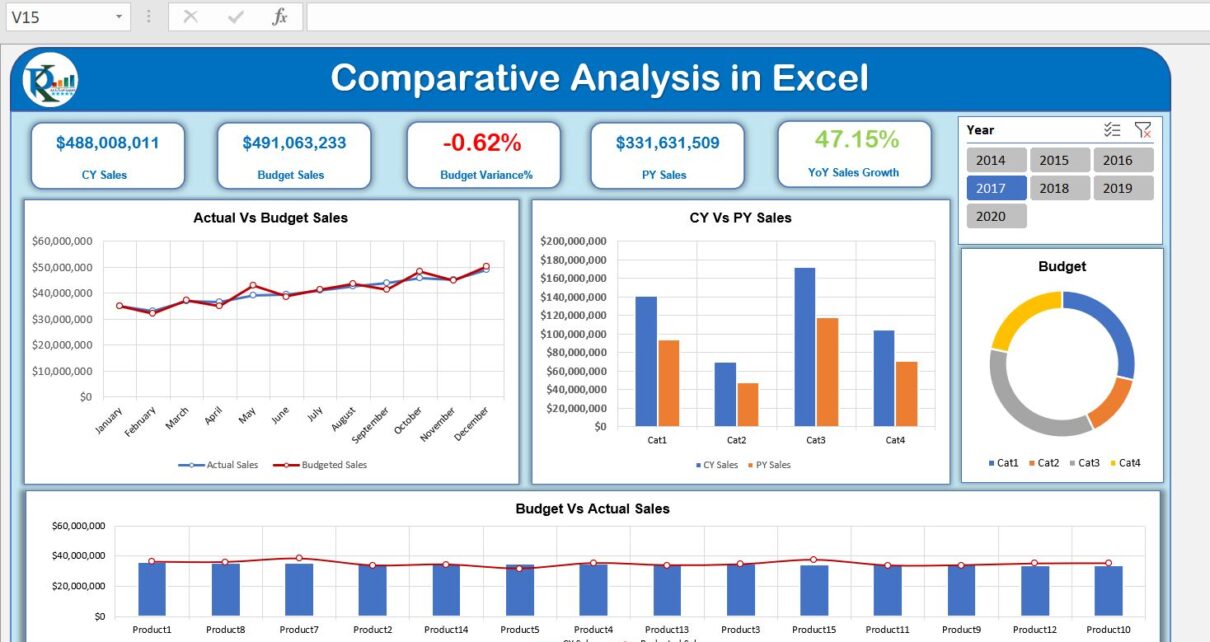
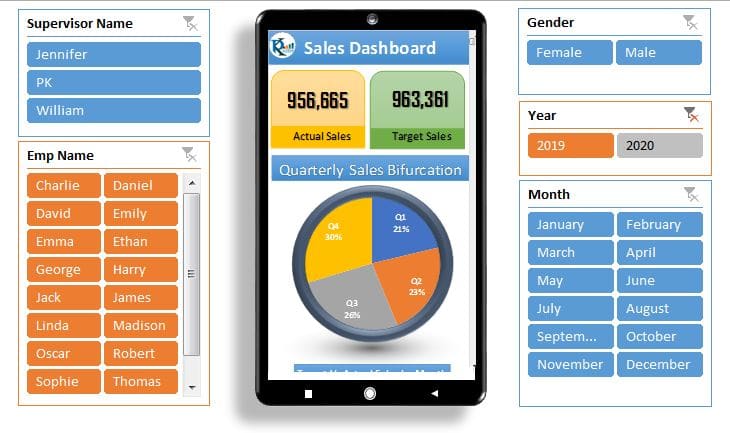
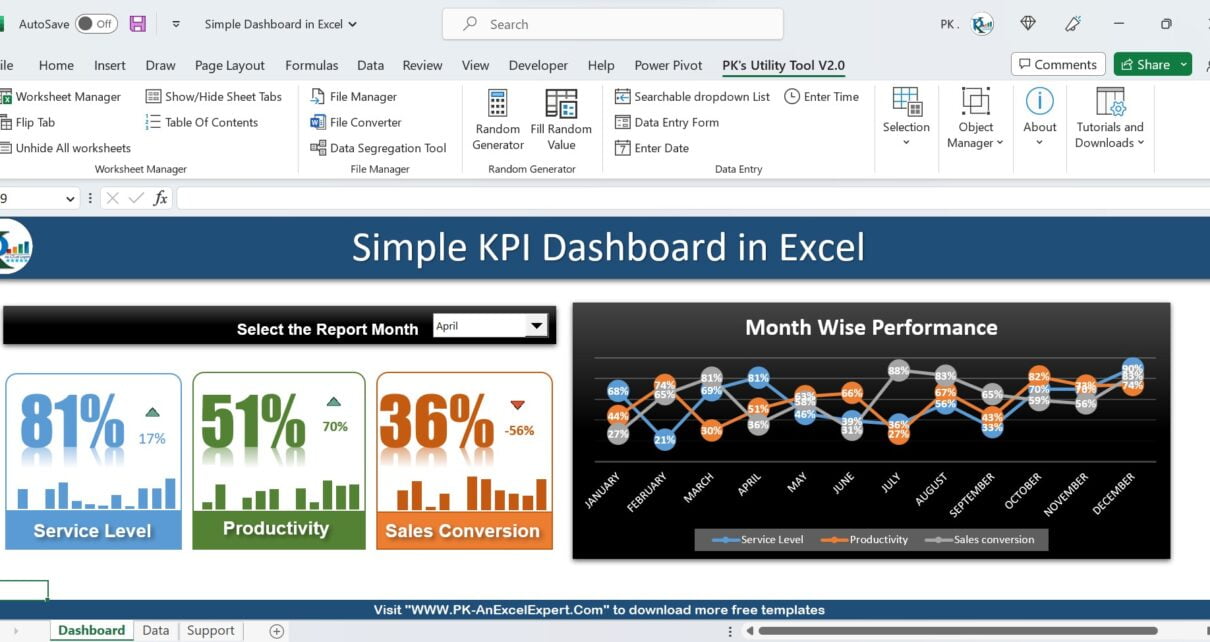
Tag: Excel Dashboard
Daily Sales Dashboard in Excel
Daily Sales dashboard is quite useful template to track your daily sales. we have created a Daily Sales Dashboard to analyze the Daily Sales trends. We have displayed 4 metrics
Annual Sales Calendar for Sales Dashboard in Excel
In this article, we have created an Annual Sales Calendar for Sales Dashboard in Excel. You can use this Sales Calendar in your sales dashboard. We have used the Combo
KPI Dashboard with Tooltip in Excel
In this article, we have created Chart Tooltip in KPI Dashboard in Microsoft Excel. You can use this trick to show the details of a number with the chart. We
Comparative Analysis Dashboard in Excel
This is the Excel version of the Comparative Analysis Dashboard. We have used Power Pivot to create this dashboard. We have used Current Year Sales Vs Previous Year Same Period
3 Useful Tips for the Pivot Chart
In this article, you will learn 3 useful tips for the Pivot Chart. Using these tips you can create an interactive Excel Dashboard. Learn and download interactive Excel Dashboard free
Dynamic Hourly Project Planner (Gantt chart)
Using Gantt charts for project management is not a new concept. Still, with the advent of advanced Excel features, creating a dynamic hourly Gantt chart has become more accessible than
Comparative Analysis Dashboard in Power BI
Introduction Comparative Analysis is very important for each business. Using these analysis they can see the insights how they are performing over a period of time. And, which product, service
Top/Bottom Analysis dashboard in Excel
In this article, we have created Top/Bottom Analysis dashboard using a sales dataset. This is a dynamic dashboard. We have used Slicers, Form control Option buttons and form control Scrollbar
Dynamic Dashboard with Tablet and Mobile shape in Excel
In this article, we have created an attractive and dynamic dashboard using Tablet and Mobile shape. We have created Tablet and Mobile shapes using Excel Shapes. We have made the