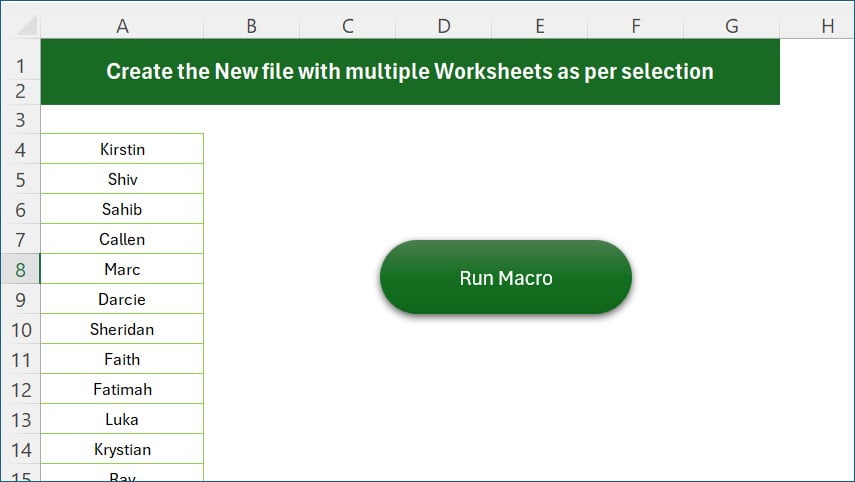
PKComments Off on Teams Goal Graph with Football icon in Excel
Ever wondered how to make your data presentations stand out? Let's dive into how you can transform raw data into an engaging Teams Goal Graph with Football icon in Excel.
PKComments Off on AI in Excel: A Game-Changer for Data Analysis
Navigating through the era of big data, it's become clear to businesses worldwide that efficient data analysis tools are essential. This article aims to shed light on AI in Excel
PKComments Off on Free Dynamic annual calendar with holiday and Control Panel
In the modern era, managing tasks and schedules is a significant challenge. This challenge can be effectively addressed by using a dynamic annual calendar that can track important dates, events,
PKComments Off on Half Circle KPI Charts in Excel using Doughnut Charts
Key Performance Indicators (KPIs) are metrics used to measure the success of a company or a particular project. KPIs can help businesses make informed decisions based on data, improve efficiency,
PKComments Off on Dynamic Attendance Sheet Using Power Pivot
Introduction In today's digital age, managing attendance in schools, colleges, or offices is a time-consuming task. This dynamic attendance sheet can help streamline this process by providing real-time attendance data
PKComments Off on 3D Chart for Weekly Sale in Excel
Data visualization is a robust strategy for presenting and analyzing vast amounts of data, uncovering trends, patterns, and relationships that may have been previously concealed. 3D charts are a distinctive
PKComments Off on Inventory Management System – 2.0
The Inventory Management System (IMS) is an essential tool for businesses of all sizes, helping them streamline and efficiently manage their stock levels. Version 2.0 offers significant improvements, providing users
An Employee Rating Table in Excel can be a powerful template to visualize and track employee performance across various parameters. So, instead of displaying simple numerical ratings, you can use
In today's business world, charts and graphs have become an essential part of data analysis. They help to present complex data in a clear and concise manner, allowing us to
This website uses cookies to improve your user experience, analyze site traffic and serve targeted ads in accordance with our Privacy PolicyACCEPT
Privacy & Cookies Policy
Privacy Overview
This website uses cookies to improve your experience while you navigate through the website. Out of these cookies, the cookies that are categorized as necessary are stored on your browser as they are essential for the working of basic functionalities of the website. We also use third-party cookies that help us analyze and understand how you use this website. These cookies will be stored in your browser only with your consent. You also have the option to opt-out of these cookies. But opting out of some of these cookies may have an effect on your browsing experience.
Necessary cookies are absolutely essential for the website to function properly. This category only includes cookies that ensures basic functionalities and security features of the website. These cookies do not store any personal information.
Any cookies that may not be particularly necessary for the website to function and is used specifically to collect user personal data via analytics, ads, other embedded contents are termed as non-necessary cookies. It is mandatory to procure user consent prior to running these cookies on your website.