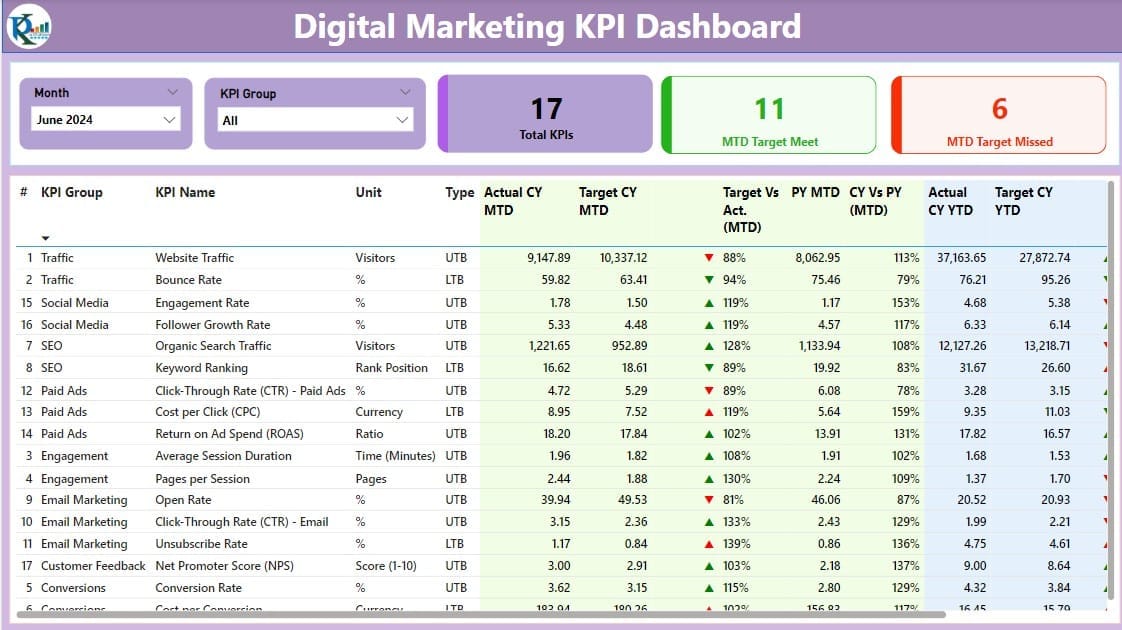
Digital Marketing KPI Dashboard in Power BI
The Digital Marketing KPI Dashboard in Power BI is a versatile and user-friendly solution for tracking, managing, and visualizing your key performance indicators (KPIs). Whether you're monitoring ad campaigns, website