PKComments Off on HR Attrition and Head Count Analysis Dashboard in Excel – FREE download
Welcome to our comprehensive guide on how to create an HR Attrition and Head Count Analysis Dashboard in Excel, complete with a free downloadable template! This user-friendly dashboard, built using
PKComments Off on KANBAN Board with Power Pivot and VBA for Project Management
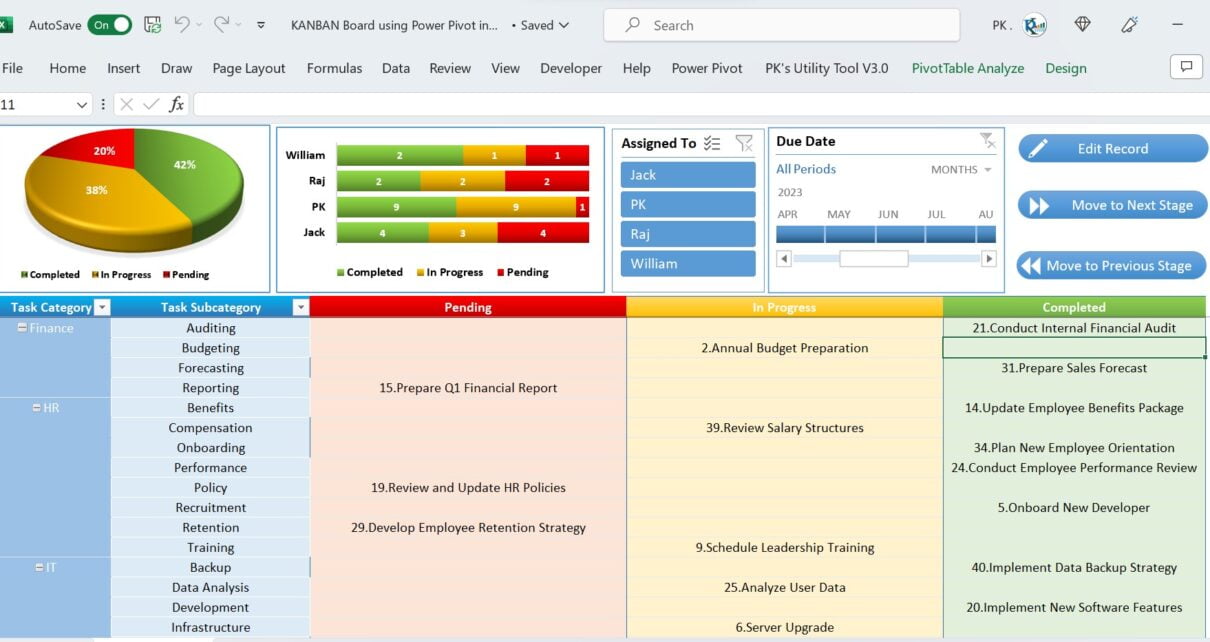
In today's fast-paced business environment, effective project management is essential for achieving success. One tool that has gained significant popularity in recent years is the KANBAN board. In this comprehensive
PKComments Off on Dynamic Attendance Sheet Using Power Pivot
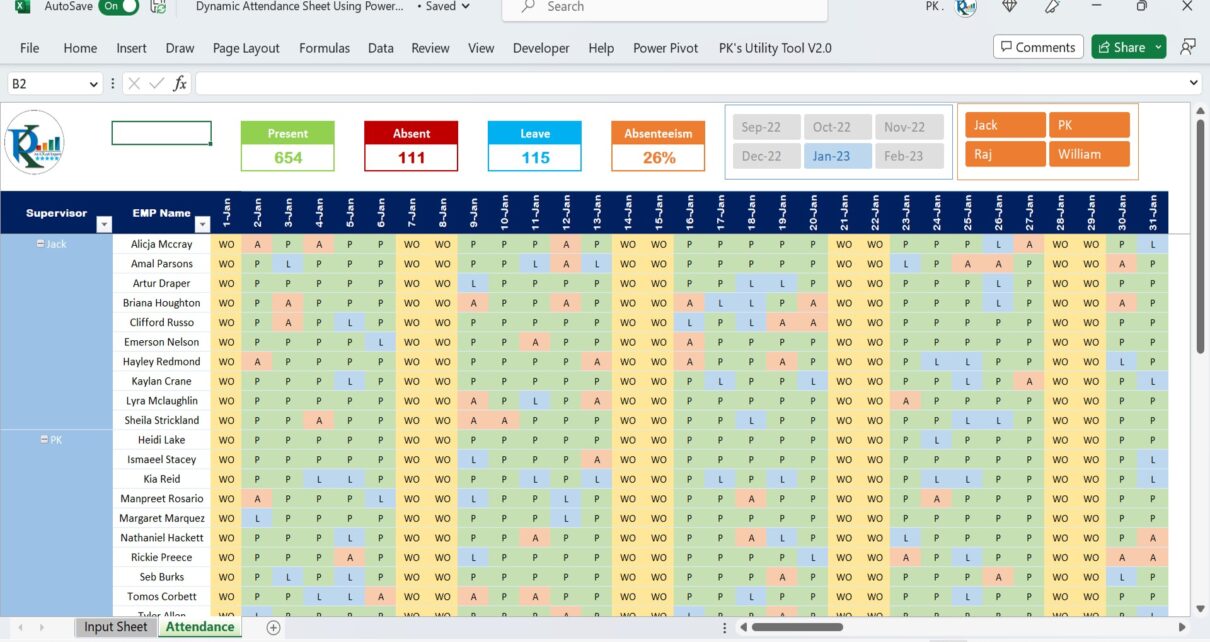
Introduction In today's digital age, managing attendance in schools, colleges, or offices is a time-consuming task. This dynamic attendance sheet can help streamline this process by providing real-time attendance data
PKComments Off on Data Transformation to Create Comma Separated List Automatically
Data transformation is an important aspect of data analysis and is often used to manipulate data in a way that suits our needs. One such manipulation is to Create Comma
PKComments Off on Comparative Analysis Dashboard in Excel
This is the Excel version of the Comparative Analysis Dashboard. We have used Power Pivot to create this dashboard. We have used Current Year Sales Vs Previous Year Same Period
PKComments Off on Power Gantt Chart (Project Planner) for Project Management
In the article, we have created the Power Gantt Chart (Project Planner) for Project Management in Microsoft Excel with Power Pivot. You can use this template for your Project Management
PKComments Off on KPI in Power Pivot for dashboard and report
Key performance indicators (KPIs) are visual measures of performance. Based on a specific calculated field, a KPI in Power Pivot for dashboard is designed to help users quickly evaluate the
In this article, we have explained how to use Measure in Pivot Pivot data model. We have taken the example of SUMX function to calculate the revenue. On the base
PKComments Off on Calculated Column in Power Pivot (LOOKUPVALUE Vs RELATED)
In this article, we have explained how to use calculated column in Power Pivot Data Model. We have taken the example of Orders data wherein we have product level Unit
PKComments Off on Drill Down/Drill Up Feature in Pivot Chart
In this article, we have created a Drill Down/Drill Up Feature functionality in a Pivot chart. We have created a hierarchy in Power Pivot data model to create this. Below are
This website uses cookies to improve your user experience, analyze site traffic and serve targeted ads in accordance with our Privacy PolicyACCEPT
Privacy & Cookies Policy
Privacy Overview
This website uses cookies to improve your experience while you navigate through the website. Out of these cookies, the cookies that are categorized as necessary are stored on your browser as they are essential for the working of basic functionalities of the website. We also use third-party cookies that help us analyze and understand how you use this website. These cookies will be stored in your browser only with your consent. You also have the option to opt-out of these cookies. But opting out of some of these cookies may have an effect on your browsing experience.
Necessary cookies are absolutely essential for the website to function properly. This category only includes cookies that ensures basic functionalities and security features of the website. These cookies do not store any personal information.
Any cookies that may not be particularly necessary for the website to function and is used specifically to collect user personal data via analytics, ads, other embedded contents are termed as non-necessary cookies. It is mandatory to procure user consent prior to running these cookies on your website.