A Task Management Dashboard is a visual representation of your tasks, deadlines, and progress. It allows you to track and manage your tasks effectively, ensuring that nothing falls through the cracks. Excel, with its powerful data manipulation and visualization capabilities, is an excellent tool for creating such a dashboard.
Key Features of the Task Management Dashboard in Excel
This ready-to-use template is designed for office use. It consists of seven worksheets, each serving a unique purpose in task management.
Dashboard Sheet Tab
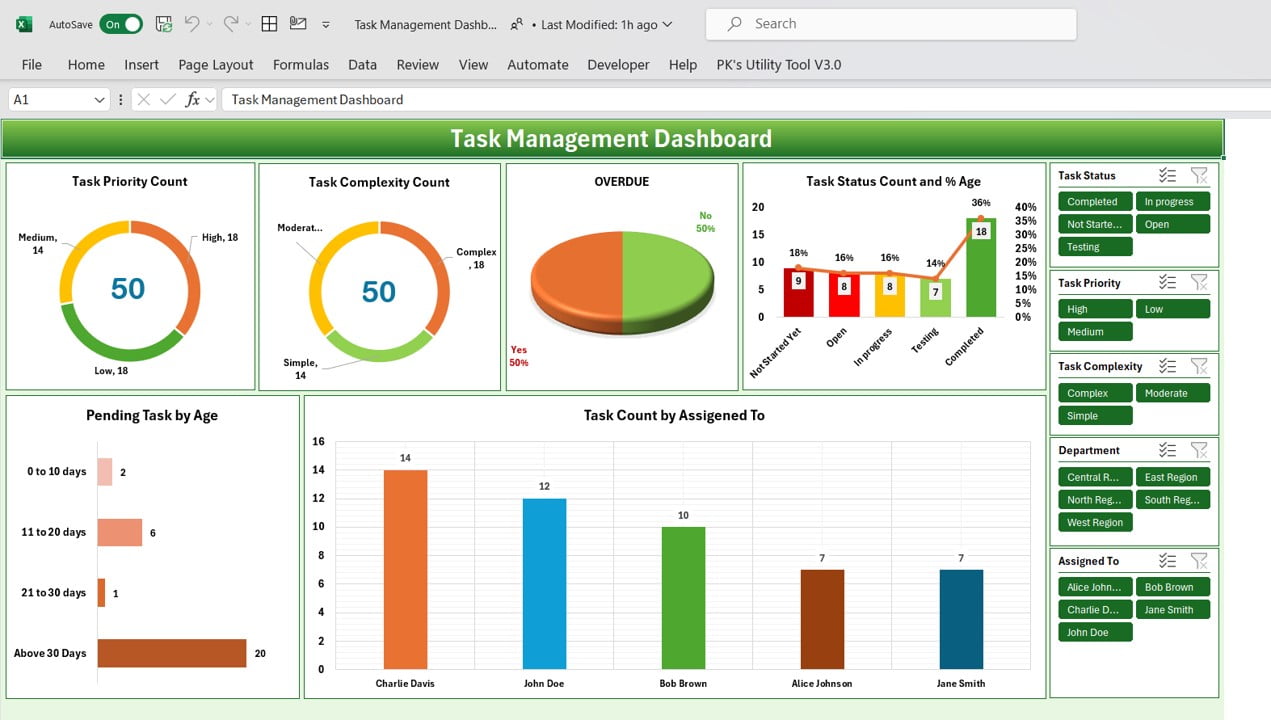
Task Management Dashboard in Excel. The heart of the Task Management Dashboard is the Dashboard Sheet. This tab provides a visual summary of your tasks through various charts and slicers.
Charts
- Task County by Priority: A Doughnut Chart that categorizes tasks by priority (Medium, High, Low).
- Task Count by Complexity: Another Doughnut Chart that breaks down tasks by their complexity (Moderate, Complex, Simple).
- Task Management by Overdue: A 3D Pie Chart showing the total number of overdue tasks.
- Task Count by Status and Percentage: A Column Chart displaying task statuses such as Not Started Yet, Open, In Progress, Testing, and Completed.
- Pending Tasks by Age: A Bar Chart that calculates the number of days tasks have been pending.
- Task Count by Assigned to: A Bar Chart that shows task distribution among team members.
Slicers
Slicers in Excel act as filters, allowing you to focus on specific data points. In this dashboard, slicers are available for Task Status, Task Priority, Task Complexity, Department, and Assigned To.
Schedule Sheet tab:
This sheet helps you keep track of your task schedule with a simple and intuitive interface of Gantt Chart.
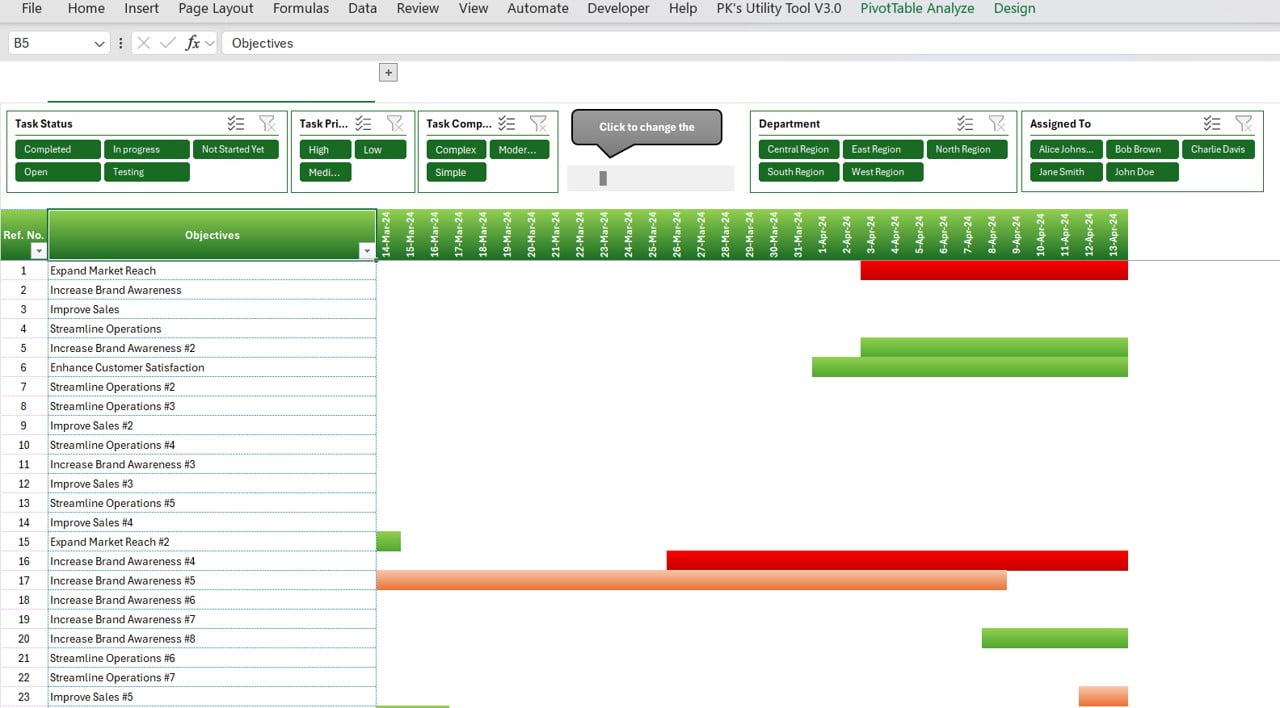
Top Section:
Here, you’ll find three slicers and an option to change the view according to your preference.
Middle Section:
The middle section contains an Objectives Table where you can list and track your primary objectives. It is a Gantt View.
Kanban Board Sheet tab:
The Kanban Board is an essential tool for task management, providing a visual way to track the progress of ta
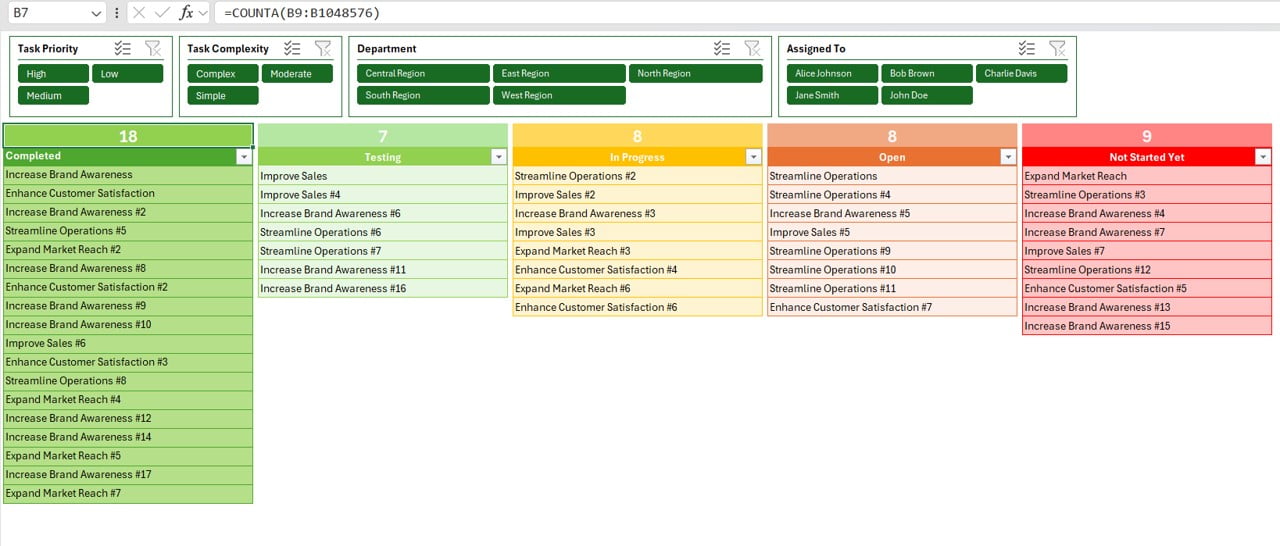
Slicers and Table
The Kanban Board includes four slicers and a table displaying tasks categorized as Completed, Testing, In Progress, Open, and Not Started Yet.
Annual Heatmap Sheet tab
Annual Heatmap The Annual Heatmap is a dynamic tool that provides an overview of tasks throughout the year.
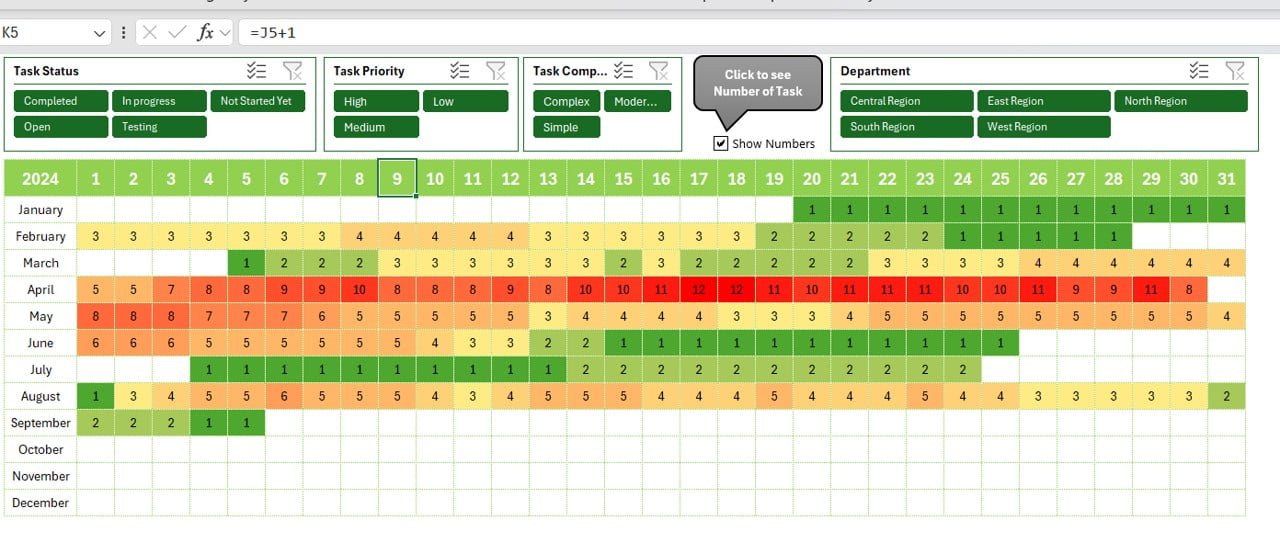
Annual Heatmap Sheet tab
Click to Use Slicers
These slicers allow you to filter tasks by various criteria, making it easier to analyze task distribution over time.
Input Data Sheet
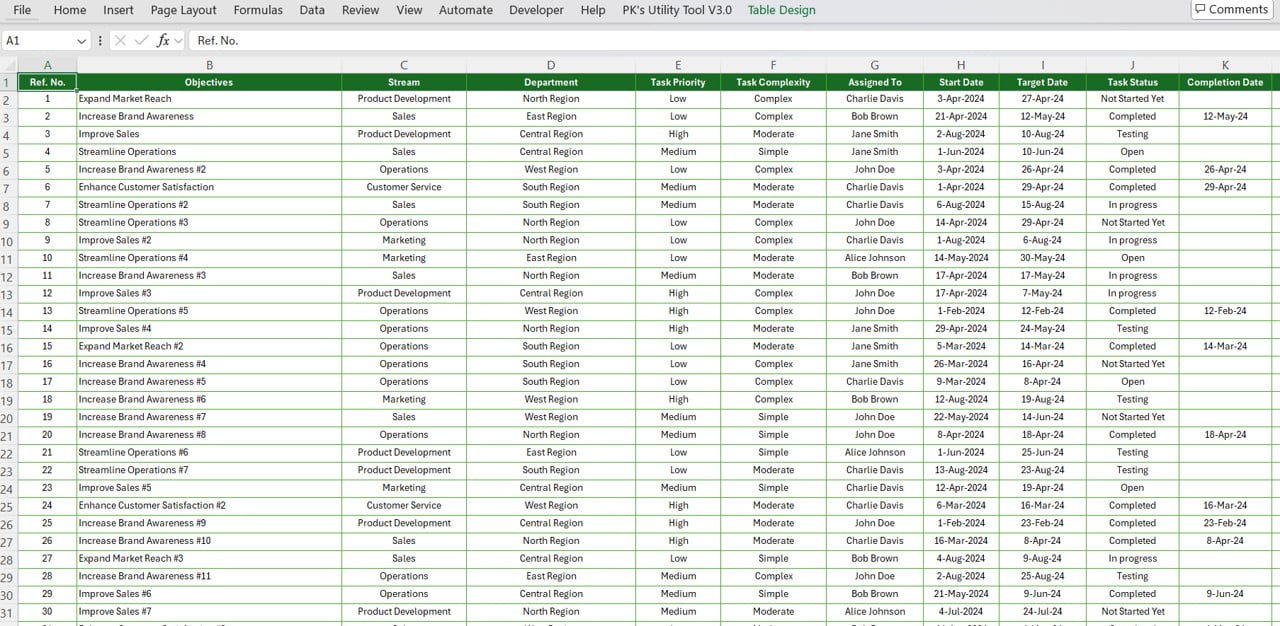
Input Data Sheet This is where you input all the necessary data to populate your dashboard.
Data Entry Columns:
You can enter data in columns such as Department, Task Priority, Task Complexity, Task Status, Assigned To, and Pending Age.
Support Sheet
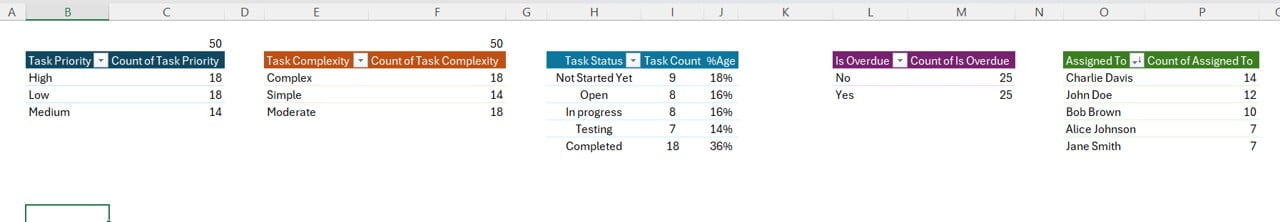
Support Sheet The Support Sheet is hidden but essential. It contains pivot tables that are connected to the Dashboard Sheet, enabling the dynamic functionality of the dashboard.
Advantages of Using a Task Management Dashboard in Excel
Streamlined Task Management
By centralizing all your tasks in one place, this dashboard simplifies the management process, allowing you to focus on what’s important.
Visual Clarity
Charts and graphs provide a clear visual representation of your tasks, making it easier to identify bottlenecks and areas that need attention.
Customizable and Flexible
Excel’s flexibility allows you to customize the dashboard to meet your specific needs, whether it’s adding new charts, modifying slicers, or integrating additional data sources.
Enhanced Collaboration
With features like the Kanban Board and task assignment tracking, this dashboard promotes collaboration by clearly showing who is responsible for each task.
Opportunity for Improvement in Task Management Dashboards
Automation
Integrating more automation features, such as task alerts and progress reminders, could further enhance productivity.
Integration with Other Tools
While Excel is powerful, integrating the dashboard with other task management tools like Trello or Asana could provide a more comprehensive task management solution.
Enhanced Data Visualization
Although the current charts are effective, incorporating more advanced data visualization techniques, such as interactive dashboards, could offer deeper insights.
User Interface Design
Improving the UI design to make it more intuitive and user-friendly could help users, especially beginners, navigate and utilize the dashboard more effectively.
Best Practices for Using the Task Management Dashboard
Regular Updates
Ensure that the dashboard is updated regularly with the latest task information to keep it relevant and accurate.
Consistent Data Entry
Consistency in data entry is crucial. Make sure that all team members use the same naming conventions and categorization to avoid discrepancies.
Leverage Slicers
Use slicers effectively to filter and view specific data points, making it easier to focus on particular tasks or departments.
Customize for Your Needs
Don’t hesitate to customize the dashboard to fit your specific requirements. Excel offers endless possibilities for personalization.
Conclusion: Why You Should Use a Task Management Dashboard in Excel
A Task Management Dashboard in Excel is more than just a tool—it’s a comprehensive solution for managing your tasks efficiently. Whether you’re managing personal tasks or overseeing a team project, this dashboard provides the structure, visibility, and flexibility you need to stay on top of your workload.
Frequently Asked Questions (FAQs)
Q1. What is a Task Management Dashboard in Excel?
Ans. Task Management Dashboard in Excel is a tool that helps you organize, track, and manage tasks using visual charts and data slicers.
Q2. How do I input data into the dashboard?
Ans. You can input data in the Input Data Sheet, where you’ll find columns for Department, Task Priority, Task Complexity, Task Status, Assigned To, and Pending Age.
Q3.Can I customize the dashboard?
Yes, the dashboard is fully customizable. You can modify charts, add new data points, and integrate it with other tools to meet your specific needs.
Q4. What are the benefits of using this dashboard?
Ans. The benefits include streamlined task management, visual clarity, enhanced collaboration, and the ability to customize the dashboard to your needs.
Q5. How often should I update the dashboard?
Ans. It’s recommended to update the dashboard regularly, preferably daily or weekly, to ensure it reflects the most current task information.
This outline provides a comprehensive structure for your article, ensuring that it is detailed, engaging, and SEO-friendly. You can expand on each section to reach the desired word count.
Visit our YouTube channel to learn step-by-step video tutorials
Watch the step-by-step video tutorial: