In today’s fast-paced telecom industry, maintaining an efficient and high-performing network is critical for service providers. The Telecom Network KPI Dashboard is a powerful tool designed to provide telecom operators with a comprehensive overview of their network’s performance. This dashboard includes key performance indicators (KPIs) that help monitor and optimize network quality, customer satisfaction, and business outcomes.
This article will guide you through the essentials of creating and utilizing a Telecom Network KPI Dashboard, outlining key KPIs, their units, aggregation formulas, and their definitions. Additionally, we will explore best practices, opportunities for improvement, and more. Let’s dive into the world of Telecom Network KPIs!
What is a Telecom Network KPI Dashboard?
A Telecom Network KPI Dashboard is a ready-to-use template that helps telecom operators monitor the most crucial aspects of their network. With this tool, operators can evaluate performance metrics, track trends, and identify areas for improvement. The dashboard displays real-time data related to various KPIs, giving a clear picture of network performance.
The main objective of a Telecom Network KPI Dashboard is to make it easier for network managers and telecom executives to monitor the status of different network parameters, ensuring that service quality is up to the mark and customer expectations are met. This dashboard simplifies decision-making, ultimately helping telecom companies reduce downtime and improve overall network efficiency.
Key Features of the Telecom Network KPI Dashboard
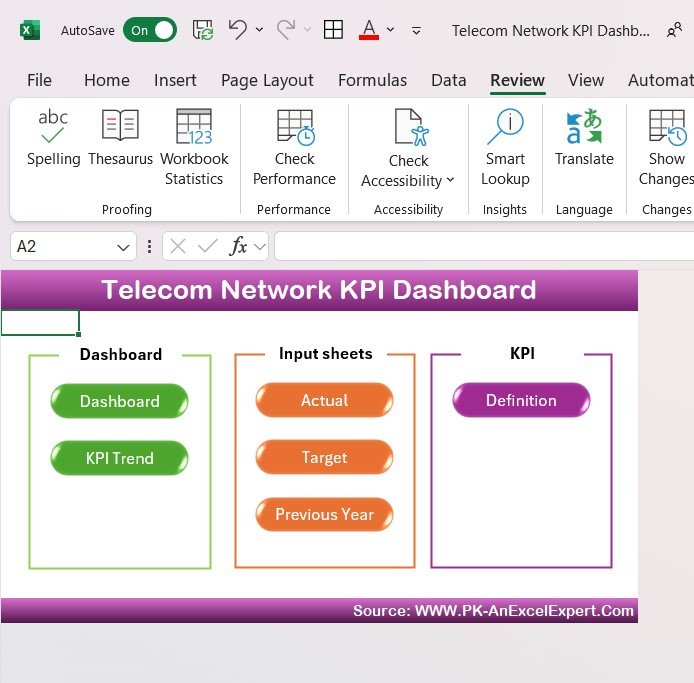
The Telecom Network KPI Dashboard is built with seven essential worksheets that help streamline the monitoring and management of network KPIs:
1. Home Sheet:
The home sheet acts as the index page of the dashboard. It provides navigation buttons to quickly jump to each of the other worksheets. This sheet allows users to quickly access different sections, ensuring a smooth experience while working with the dashboard.
Click to Purchase Telecom Network KPI Dashboard in Excel
2. Dashboard Sheet Tab:
This is the main sheet, where most of the KPI data is displayed. On this sheet, users can view:
- MTD (Month-to-Date) and YTD (Year-to-Date) Actual Values: These metrics show the actual performance for the current month and year, respectively.
- Target and Previous Year Data: This section compares actual data against the target values and previous year’s performance.
- Conditional Formatting: With the use of up and down arrows, the dashboard visually highlights whether the targets are being met or missed, making it easier to spot issues and successes at a glance.

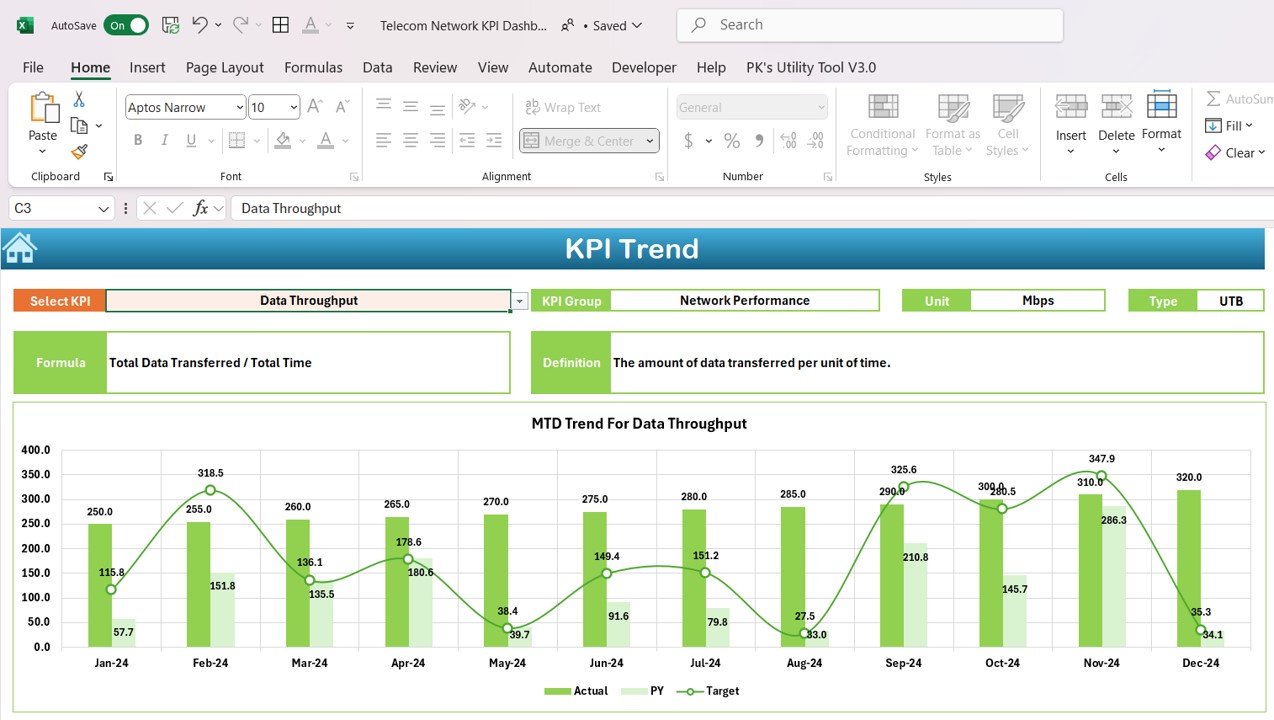
3. KPI Trend Sheet Tab:
In this tab, users can select different KPIs to monitor. The sheet shows:
- The KPI Group (e.g., Network Performance, Customer Satisfaction).
- The Unit of Measurement for each KPI (e.g., Mbps, %).
- The Type of KPI (whether the KPI is one where lower values are better, or upper values are better).
- Formula for Calculating KPI: This explains how the KPI values are derived.
- Definition of the KPI: This provides users with a clear understanding of what each KPI represents and how it affects network performance.
4. Actual Number Sheet Tab:
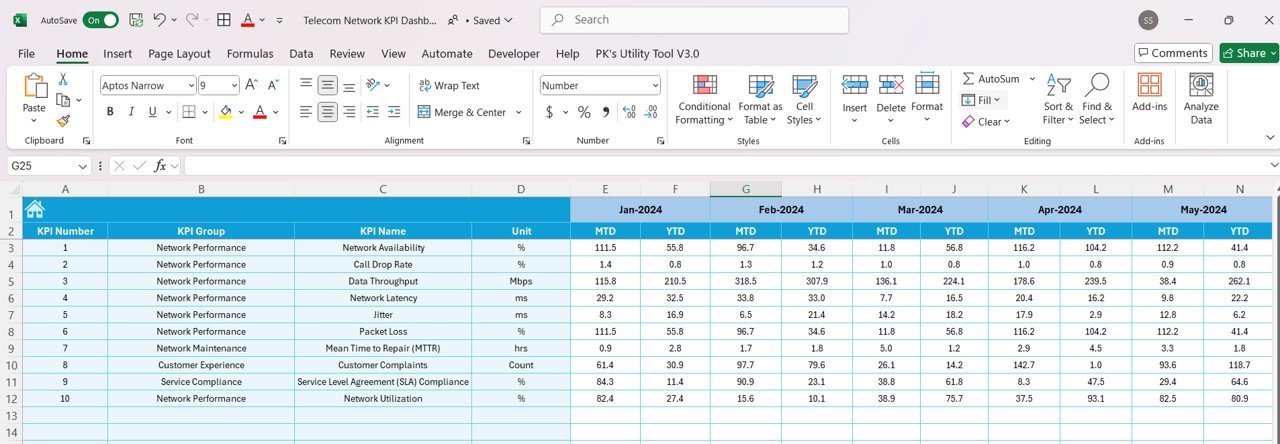
This sheet is designed for inputting MTD and YTD values for each month. It allows users to update the data based on real-time performance. The first month of the year is inputted, and all subsequent monthly data is automatically updated, making it easy to track performance over time.

5. Target Sheet Tab:
In this tab, users enter the target values for each KPI. The targets should be set for both MTD and YTD, giving users a clear goal to compare against the actual performance data.
6. Previous Year Number Sheet Tab:
This tab allows users to input previous year data for each KPI. By comparing this data to the current year’s values, users can identify trends, progress, and potential areas for improvement.

7. KPI Definition Sheet Tab:
In this sheet, all KPIs are defined in detail, including:
- KPI Name
- KPI Group
- Unit of Measurement
- Formula for Calculation
- Detailed Definition of the KPI
Click to Purchase Telecom Network KPI Dashboard in Excel
Advantages of Telecom Network KPI Dashboard
The Telecom Network KPI Dashboard offers several advantages that enhance network management and decision-making processes:
- Real-Time Monitoring: The dashboard provides real-time data, allowing network managers to make informed decisions quickly and effectively.
- Comprehensive Overview: It consolidates multiple KPIs into one platform, offering a holistic view of the network’s performance.
- Improved Performance Tracking: By comparing actual data with targets and previous years, users can identify trends, track performance, and take corrective actions.
- Enhanced Customer Experience: Monitoring KPIs like customer satisfaction and churn rate helps telecom companies ensure they are meeting customer expectations.
- Efficient Decision Making: With a quick view of critical network data, decision-makers can act proactively and prevent potential issues.
Opportunities for Improvement in Telecom Network KPI Dashboard
While the Telecom Network KPI Dashboard offers numerous benefits, there are always opportunities for improvement:
- Automation of Data Input: Automating data entry can reduce human error and ensure more accurate tracking. Integrating the dashboard with real-time data sources can help keep the information up-to-date without manual input.
- Advanced Data Visualization: Incorporating advanced visualization tools like heatmaps, interactive graphs, and 3D charts could make the dashboard even more user-friendly and insightful.
- Custom Alerts and Notifications: Adding a feature for custom alerts could notify users when KPIs fall below or exceed certain thresholds, allowing for faster responses to network issues.
Best Practices for Telecom Network KPI Dashboard
To get the most out of your Telecom Network KPI Dashboard, here are some best practices to follow:
- Define Clear KPIs: Make sure your KPIs are well-defined and aligned with business goals. Each KPI should have a clear formula and a measurable target.
- Regularly Update the Dashboard: Ensure that the data is consistently updated to reflect the most current network performance and customer feedback.
- Prioritize Key Metrics: Focus on the most impactful KPIs to avoid information overload. Key metrics like Network Availability, Customer Satisfaction, and Latency should be prioritized.
- Ensure Data Accuracy: Input data accurately and consistently. Automated data entry will help avoid human error and ensure the reliability of the dashboard.
- Monitor Performance Regularly: Review the dashboard frequently to identify potential issues before they escalate. This will help in making quick adjustments and improving network performance.
Frequently Asked Questions (FAQs)
What is the purpose of a Telecom Network KPI Dashboard?
The Telecom Network KPI Dashboard provides telecom operators with a clear and concise overview of network performance, customer satisfaction, and other key metrics, allowing them to make informed decisions and optimize their services.
How often should I update the Telecom Network KPI Dashboard?
It is recommended to update the dashboard on a monthly basis, especially for KPIs like MTD and YTD values. For real-time monitoring, you may consider automating data updates through integration with network management tools.
Can the Telecom Network KPI Dashboard be customized?
Yes, the dashboard is highly customizable. You can add or remove KPIs, change the data input methods, or adjust the layout to better suit your organization’s specific needs.
How can I improve customer satisfaction with the dashboard?
By monitoring customer satisfaction metrics and addressing issues related to latency, packet loss, and churn rates, you can make informed decisions that improve the overall customer experience.
Conclusion
The Telecom Network KPI Dashboard is an indispensable tool for telecom operators who wish to optimize network performance and customer satisfaction. By tracking critical KPIs, such as network availability, customer churn, and latency, businesses can proactively address issues and improve service delivery. Utilizing best practices and taking advantage of the opportunities for improvement will further enhance the dashboard’s effectiveness.
By regularly reviewing and updating the dashboard, you ensure that the telecom network stays efficient and meets the evolving needs of your customers. Start using the Telecom Network KPI Dashboard today and take your network management to the next level!
Visit our YouTube channel to learn step-by-step video tutorials
View this post on Instagram


