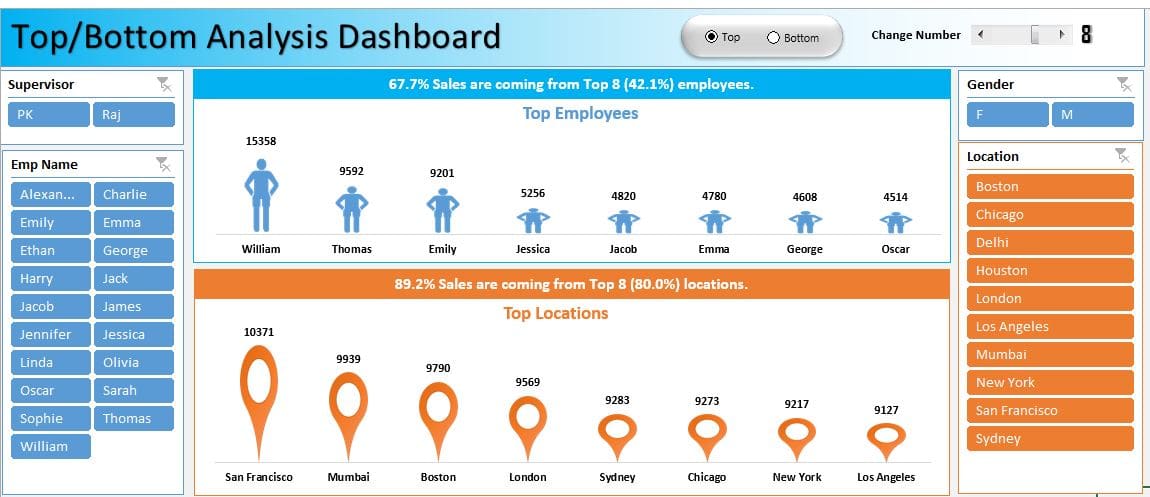
In this article, we have created Top/Bottom Analysis dashboard using a sales dataset. This is a dynamic dashboard. We have used Slicers, Form control Option buttons and form control Scrollbar to make it dynamic.
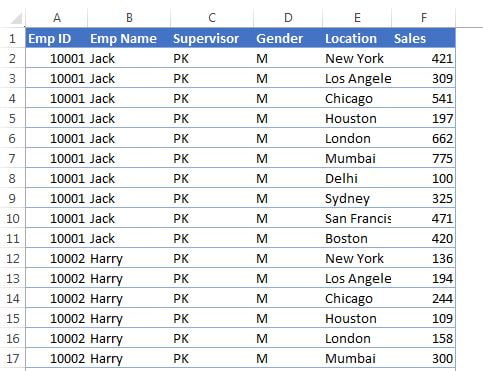
We have used below given sales data to create this dashboard-
Click to buy Top Bottom Analysis dashboard in Excel
Using the Top/Bottom option button, you can display the Top or bottom employees and locations. You can use the scroll bar to change the number of employees and locations.
Click to buy Top Bottom Analysis dashboard in Excel
Visit our YouTube channel to learn step-by-step video tutorials
Watch the step by step video tutorial :
Click to buy Top Bottom Analysis dashboard in Excel