In today’s rapidly evolving corporate world, the need for an efficient training and development program is crucial for enhancing employee performance. Companies are now using powerful business intelligence tools, such as Power BI, to manage and analyze their training programs. One such tool is the Training and Development Dashboard in Power BI, which allows organizations to track the effectiveness of their training initiatives and gain valuable insights to improve future training programs.
This article provides a detailed guide on creating a Training and Development Dashboard in Power BI. By the end, you will have the knowledge to set up a dynamic and interactive dashboard to monitor and evaluate your company’s training efforts.
What is a Training and Development Dashboard in Power BI?
A Training and Development Dashboard in Power BI is a visual representation of training data, designed to give HR professionals and managers a quick overview of the company’s training programs. It allows you to monitor various key performance indicators (KPIs) such as employee progress, training costs, feedback scores, and much more. With Power BI’s interactive features, this dashboard offers a dynamic way to drill down into the data and make informed decisions based on real-time insights.
Benefits of a Training and Development Dashboard in Power BI
- Efficient Tracking of Training Programs: The dashboard helps in keeping track of training activities, employee progress, and costs. It provides a single source of truth for all your training data.
- Real-time Insights: You can monitor the effectiveness of training programs in real time and quickly identify areas for improvement.
- Enhanced Decision-Making: By visualizing training data, managers can make data-driven decisions to improve training strategies and focus on high-impact areas.
- Increased Employee Engagement: A transparent view of training outcomes encourages employees to engage with their development plans more effectively.
Key Features of a Training and Development Dashboard in Power BI
The Training and Development Dashboard consists of several dynamic pages that display detailed insights about your company’s training programs. Let’s break down the main components:
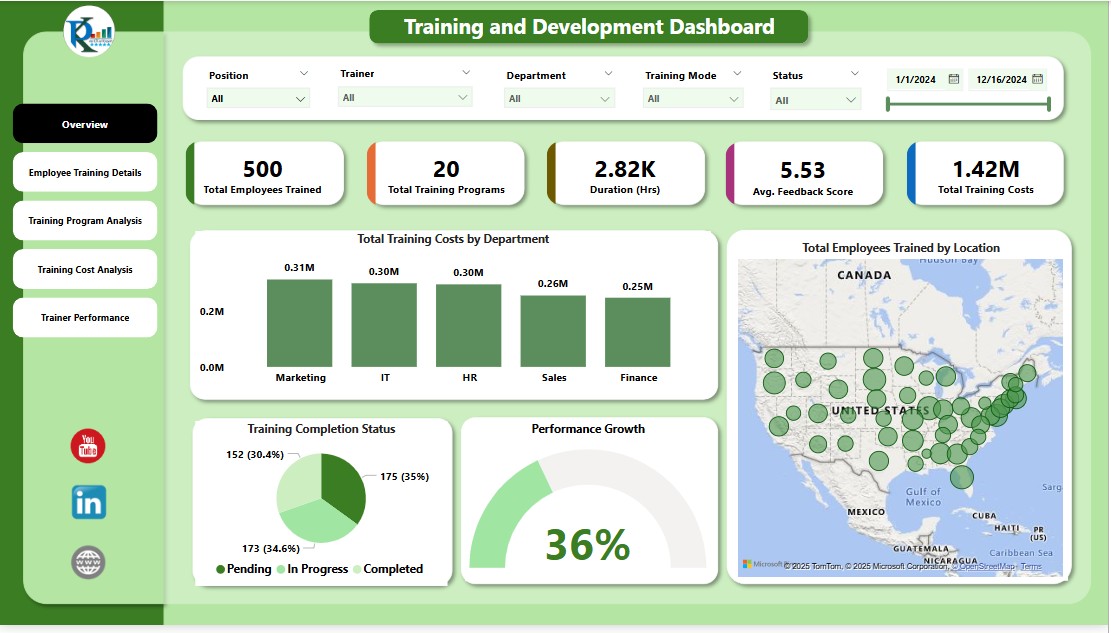
1. Overview Page
The Overview Page provides a snapshot of the overall training statistics and key metrics. It includes:
Slicers for filtering data by position, trainer, department, training mode, status, and dates.
Cards displaying key metrics such as:
- Total Employees Trained
- Total Training Programs
- Training Duration (Hours)
- Average Feedback Score
- Total Training Costs
Charts to visually represent training data:
- Total Training Costs by Department (Column Chart)
- Training Completion Status (Pie Chart)
- Performance Growth (Gauge Chart)
- Total Employees Trained by Location (Map)
Click to buy Training and Development Dashboard in Power BI
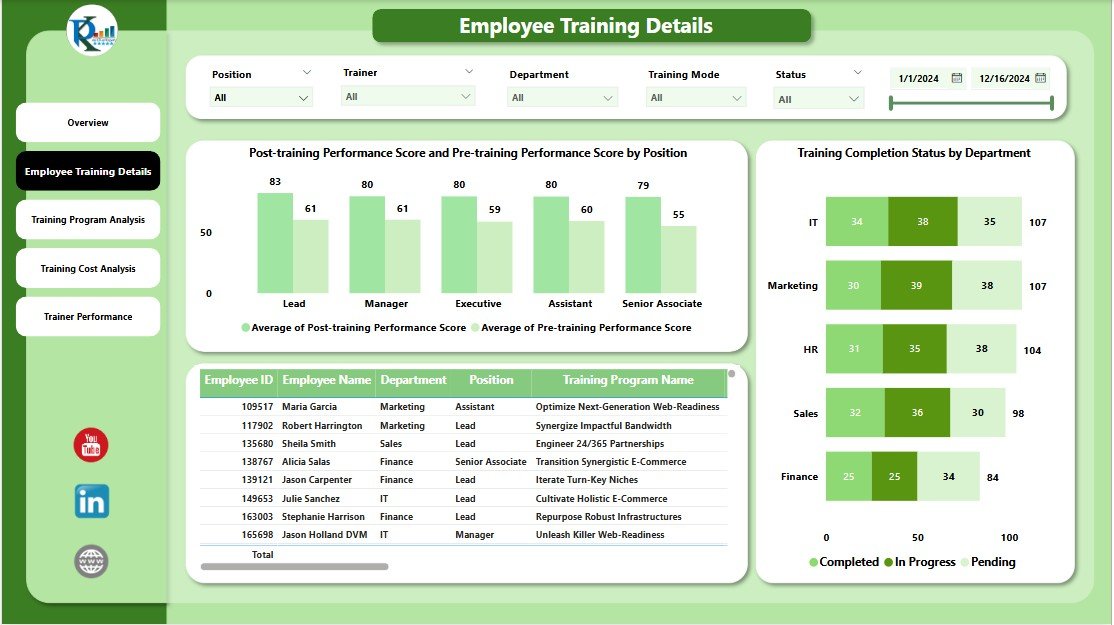
2. Employee Training Details Page
This page presents the training details for each employee. It includes:
Slicers for data filtering.
Charts:
- Post-training vs Pre-training Performance Scores by Position (Clustered Column Chart)
- Training Completion Status by Department (Bar Chart)
- Employee Training Details Table displaying individual employee data such as training program names, completion status, feedback score, and more.
Click to buy Training and Development Dashboard in Power BI
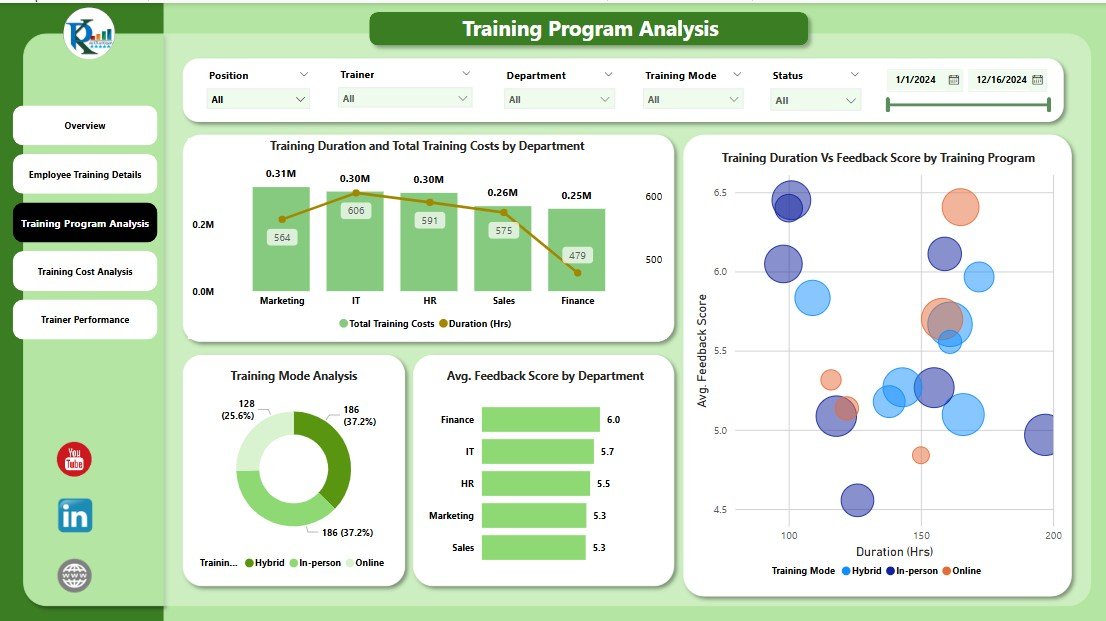
3. Training Program Analysis Page
Here, you can analyze the effectiveness of the different training programs, including:
Slicers for easy data filtering.
Charts:
- Training Duration and Total Costs by Department (Combo Chart)
- Training Mode Analysis (Donut Chart)
- Average Feedback Score by Department (Bar Chart)
- Training Duration vs Feedback Score by Training Program (Scatter Chart)
4. Training Cost Analysis Page
Click to buy Training and Development Dashboard in Power BI
The Training Cost Analysis Page focuses on the financial aspect of training, helping you analyze the costs associated with different training programs:
Slicers for filtering.
Charts:
- Average Feedback Score vs Cost Analysis (Scatter Chart)
- Total Training Costs by Position and Training Mode (Column Chart with Ribbon)
- Total Training Costs by Location (Map)

Click to buy Training and Development Dashboard in Power BI
5. Trainer Performance Page
This page evaluates trainer effectiveness by showing insights into their performance:
Slicers to filter data by trainer, department, or training mode.
Charts:
- Performance Growth vs Training Costs by Trainer and Training Mode (Scatter Chart)
- Average Feedback Score by Trainer (Column Chart)

Click to buy Training and Development Dashboard in Power BI
Advantages of the Training and Development Dashboard in Power BI
The Training and Development Dashboard in Power BI offers numerous benefits to organizations. Here are the top advantages:
- Comprehensive Training Insights: Power BI’s dynamic dashboard provides a 360-degree view of all training activities, helping managers assess training programs more effectively.
- Improved ROI on Training: By analyzing training costs, feedback scores, and performance growth, organizations can optimize their training budget and ensure maximum return on investment.
- Increased Productivity: The insights gained from the dashboard help in improving employee performance by identifying training gaps and providing targeted training opportunities.
- Scalability: The dashboard is designed to handle large volumes of data, making it scalable for both small businesses and large enterprises.
- Time-Saving: The automation of data gathering and reporting saves time, allowing HR teams to focus on strategic initiatives rather than manual tracking.
Opportunities for Improvement in Training and Development Programs
While the dashboard is a powerful tool for monitoring and optimizing training, there are always opportunities for improvement. Here are some ways you can enhance your training and development programs based on dashboard insights:
- Personalized Training Plans: Use feedback and performance scores to tailor training plans for individual employees. Customizing the training journey for each employee can lead to better engagement and results.
- Focus on Underperforming Areas: If certain departments or training programs consistently show lower performance scores, it’s essential to delve deeper into these areas and identify the root causes.
- Evaluate Trainer Effectiveness: Regularly assess the performance of trainers and provide additional resources or training if necessary. The Trainer Performance Page can help identify top-performing trainers and areas where additional training may be needed.
- Optimize Training Costs: Use the insights from the Training Cost Analysis Page to evaluate the cost-effectiveness of different training programs. Eliminate underperforming programs and allocate more resources to successful ones.
Best Practices for Using a Training and Development Dashboard in Power BI
To get the most out of your Training and Development Dashboard, follow these best practices:
- Regularly Update the Data: Ensure that the data feeding into the dashboard is up to date. Regular updates will provide more accurate insights and help make real-time decisions.
- Encourage Cross-Department Collaboration: Use the dashboard to facilitate conversations between HR, training departments, and other teams. Collaboration can help identify areas for improvement and align training programs with business objectives.
- Monitor KPIs Closely: Focus on the key performance indicators (KPIs) displayed in the dashboard, such as training completion rates, feedback scores, and performance improvements. Monitoring these metrics will help you identify training successes and areas for further investment.
- Leverage Drill-Down Features: Power BI allows users to drill down into specific data points. Use this feature to uncover deeper insights and investigate anomalies or trends in training data.
- Incorporate Employee Feedback: Regularly collect and incorporate feedback from employees about the training programs. This will help improve the relevance and effectiveness of future training.
Conclusion
The Training and Development Dashboard in Power BI is an essential tool for organizations looking to streamline their training processes and enhance employee performance. With its dynamic features and interactive visualizations, the dashboard empowers HR professionals to make data-driven decisions and optimize training initiatives for better outcomes. By leveraging the insights from this dashboard, organizations can maximize their training ROI and foster a more productive and engaged workforce.
Frequently Asked Questions (FAQs)
1. What are the main features of the Training and Development Dashboard in Power BI?
The dashboard includes slicers, cards, and charts that provide insights into key metrics such as training costs, employee performance, feedback scores, and more. It has pages dedicated to employee training details, training program analysis, cost analysis, and trainer performance.
2. How can I improve my training programs using the dashboard?
By analyzing data such as performance scores and feedback, you can identify underperforming areas and tailor training programs to specific employee needs. The dashboard’s insights allow for continuous improvement in training strategies.
3. Can I track individual employee progress with this dashboard?
Yes, the Employee Training Details Page allows you to track individual employee data, including their pre- and post-training performance scores, training completion status, and feedback.
4. How can I visualize training costs across different departments?
The Training Cost Analysis Page offers a column chart that displays total training costs by department, as well as maps and scatter charts that show cost distribution across locations and training modes.
5. How often should I update the dashboard data?
To ensure the accuracy and relevance of your insights, it’s important to update the data regularly—ideally, after every training session or quarterly to keep track of ongoing progress.
Click to buy Training and Development Dashboard in Power BI
Visit our YouTube channel to learn step-by-step video tutorials
Watch the step-by-step video tutorial:
Click to buy Training and Development Dashboard in Power BI