
Measuring the Return on Investment (ROI) for training programs is crucial for businesses looking to optimize their learning and development strategies. A well-structured Training ROI KPI Dashboard in Excel helps organizations track training effectiveness, employee skill development, and financial returns on training investments.
This article will guide you through the features, advantages, and best practices of using a Training ROI KPI Dashboard in Excel while ensuring you gain insights into how to measure training performance effectively.
What is a Training ROI KPI Dashboard in Excel?
A Training ROI KPI Dashboard is an Excel-based analytical tool that provides a structured way to track key performance indicators (KPIs) related to training initiatives.
- This dashboard allows you to:
- Monitor actual vs. target performance.
- Track monthly and yearly trends.
- Evaluate whether training programs are cost-effective.
- Identify areas for improvement.
By leveraging this dashboard, HR teams and business managers can make data-driven decisions regarding training investments and their impact on productivity.
Click to Training ROI KPI
Key Features of the Training ROI KPI Dashboard
This dashboard consists of seven interactive worksheets, each designed to track different aspects of training ROI efficiently.
Home Sheet (Navigation Panel)
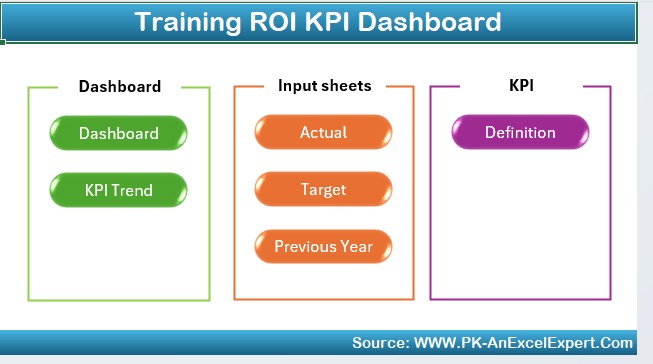
This serves as the index page of the dashboard, providing quick access to different sheets through six navigation buttons.
Dashboard Sheet Tab (Main View)
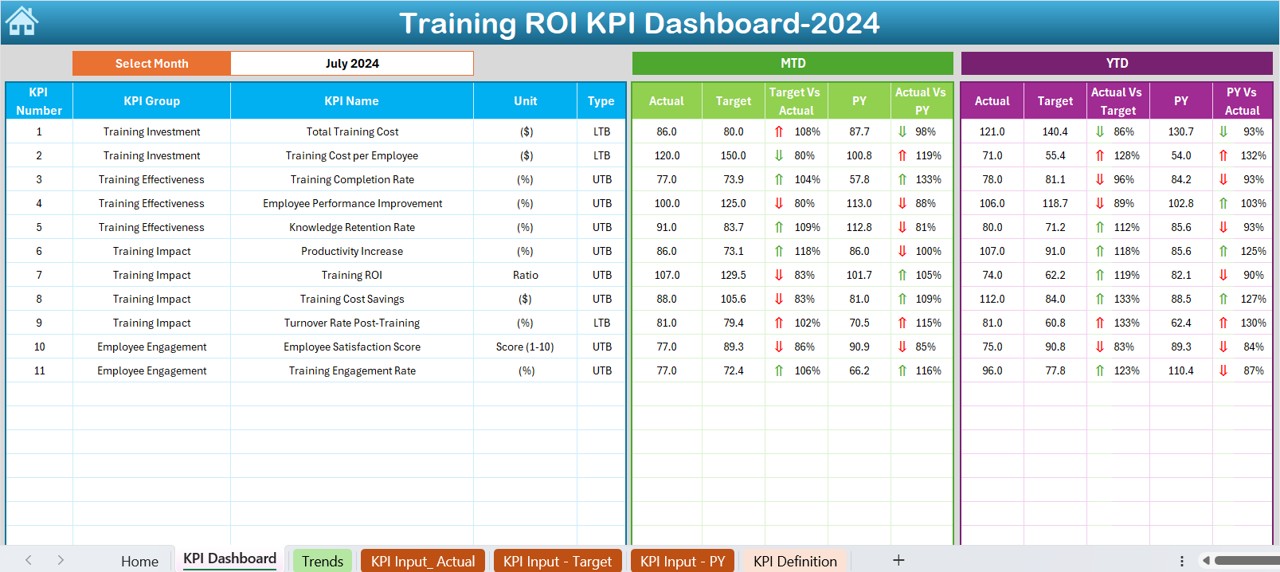
- This is the core visualization sheet displaying all KPI data:
- Users can select the Month from the drop-down menu (D3), and all dashboard figures update automatically.
- Displays Month-to-Date (MTD) and Year-to-Date (YTD) actual vs. target data.
- Includes comparison with previous year (PY).
- Uses conditional formatting (up/down arrows) for easy analysis of performance trends.
Click to Training ROI KPI
KPI Trend Sheet Tab (Performance Tracking)
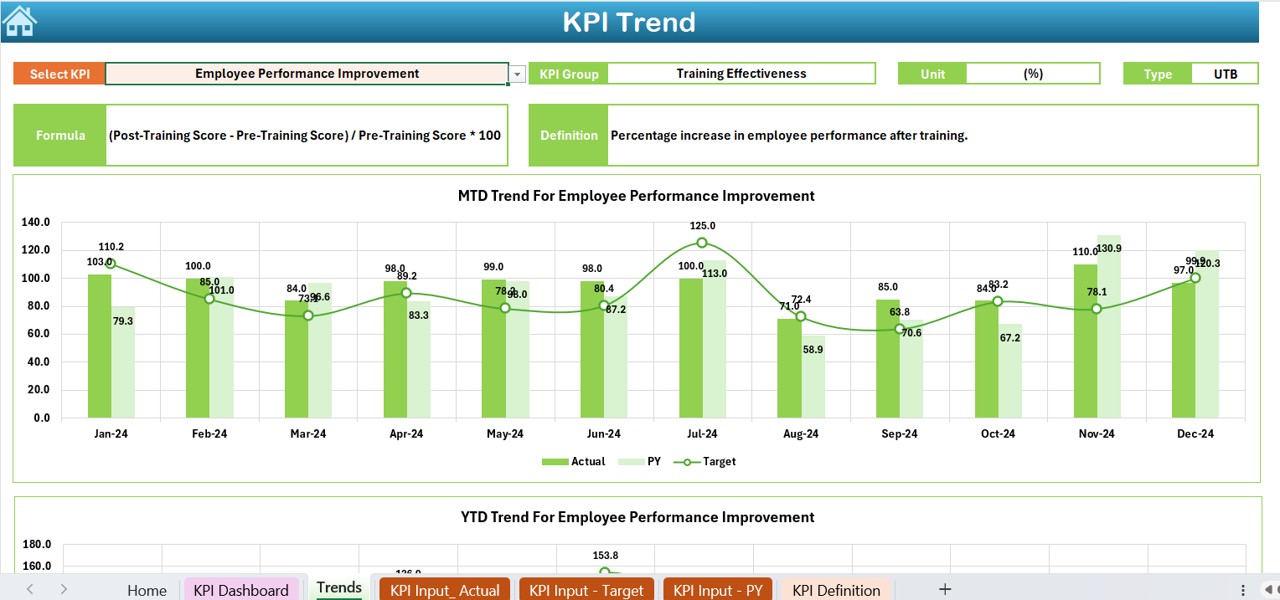
This sheet allows users to:
- Select a specific KPI from the drop-down menu (C3).
- View KPI group, unit, type (Lower is Better/Upper is Better), formula, and definition.
- Display MTD and YTD trend charts for Actual, Target, and Previous Year (PY) data.
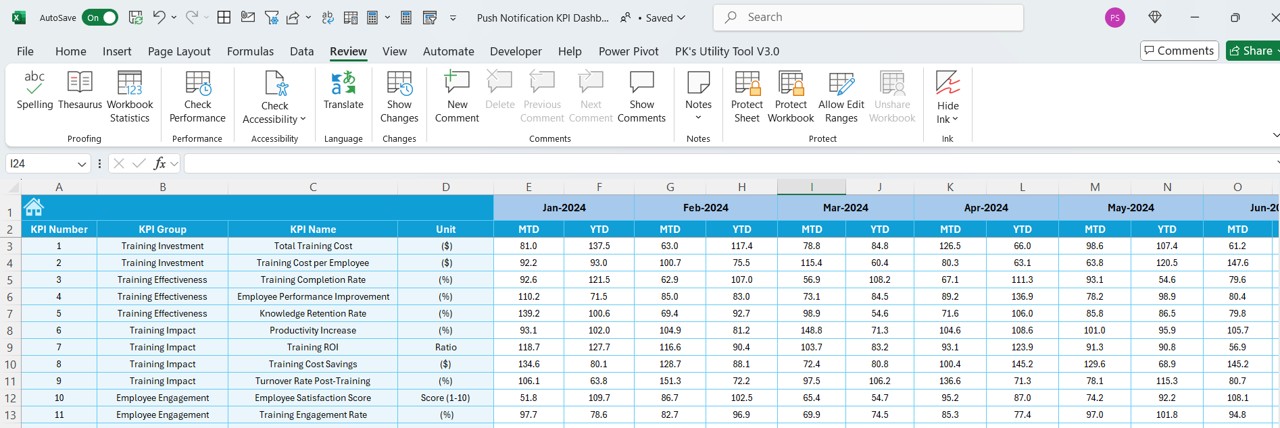
Actual Numbers Input Sheet (Data Entry for Performance)
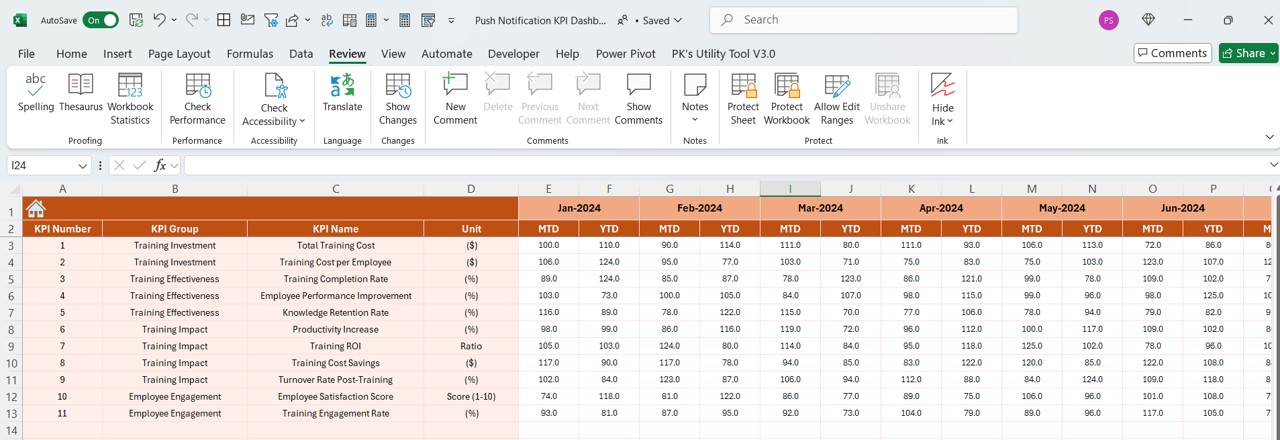
- Allows entry of MTD and YTD actual values for each month.
- Users can set the starting month of the year (E1).
Click to Training ROI KPI
Target Sheet Tab (Training Goals Setting)
- Input MTD and YTD target values for each KPI.
- Helps in performance benchmarking.
Previous Year Numbers Sheet Tab (Historical Data Storage)
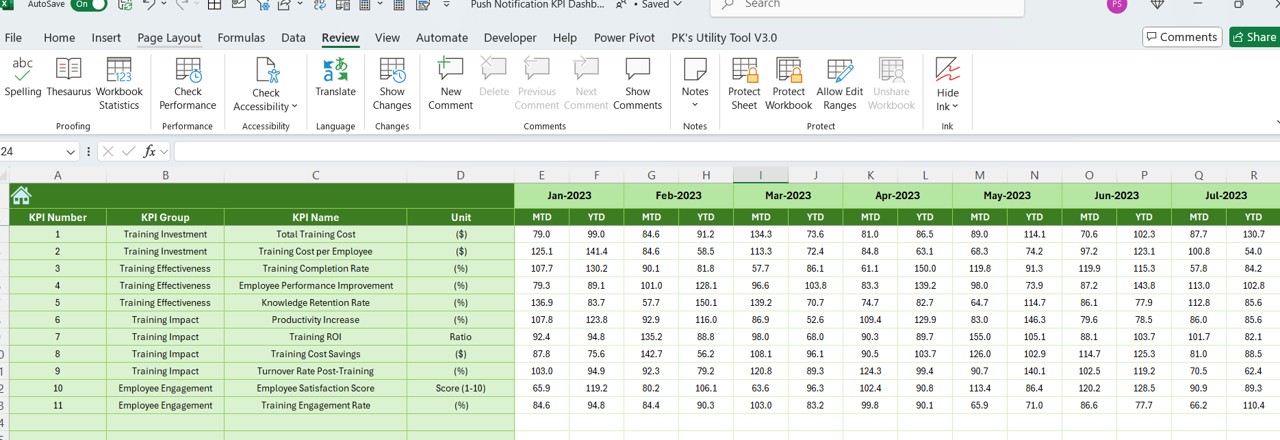
- Stores MTD and YTD performance numbers from the previous year.
- Enables trend analysis and performance comparisons.
KPI Definition Sheet Tab (Reference Guide)
Click to Training ROI KPI
- Contains KPI Names, Groups, Units, Formulas, and Definitions.
- Acts as a data dictionary for the dashboard.
Advantages of Using a Training ROI KPI Dashboard in Excel
📈 Data-Driven Decision-Making: With real-time insights, organizations can evaluate training effectiveness and optimize resources.
🏆 Performance Tracking & Comparisons: Allows businesses to compare MTD and YTD performance against targets and previous years.
🎯 Customizable for Business Needs: The dashboard can be modified to track industry-specific KPIs.
📊 Easy Visualization & Reporting: Interactive charts, trend lines, and conditional formatting make interpretation simple.
⏳ Saves Time and Reduces Manual Effort: Automated calculations eliminate the need for manual tracking and complex calculations.
Best Practices for Using the Training ROI KPI Dashboard
✅ Define Clear KPI Objectives: Before using the dashboard, outline which KPIs truly reflect training success.
✅ Regularly Update Data: Ensure accurate and timely data entry in actual numbers, targets, and previous year records.
✅ Leverage Conditional Formatting: Use visual indicators like up/down arrows and color coding to highlight trends.
✅ Compare Against Industry Standards: Benchmark against industry-specific training ROI metrics.
✅ Optimize Training Budgets: Identify underperforming training programs and reallocate resources to high-impact learning initiatives.
Frequently Asked Questions (FAQs)
What KPIs should be included in a Training ROI Dashboard?
- Some essential KPIs include:
- Training Completion Rate
- Post-Training Performance Improvement
- Employee Satisfaction Score
- Training Cost per Employee
- Revenue Impact from Training
Can I customize the Training ROI KPI Dashboard for my business?
Yes! The Excel dashboard is fully customizable. You can add new KPIs, update formulas, and modify charts based on your business needs.
Why is it important to track Training ROI?
Tracking Training ROI helps organizations justify training expenses, improve training efficiency, and align learning programs with business goals.
How frequently should I update the KPI dashboard?
It is recommended to update the dashboard monthly to ensure accurate trend analysis and decision-making.
Conclusion
A Training ROI KPI Dashboard in Excel is a powerful tool that enables organizations to measure, analyse, and optimize training programs effectively. By leveraging this dashboard, HR and training managers can make data-driven decisions, improve training efficiency, and maximize workforce potential.
Click to Training ROI KPI
Visit our YouTube channel to learn step-by-step video tutorials


