In the fast-paced world of underwriting, measuring efficiency is crucial. The Underwriting Efficiency KPI Dashboard in Excel provides a comprehensive tool for monitoring and optimizing underwriting performance. This article will walk you through the features of the dashboard, key performance indicators (KPIs), and their role in boosting underwriting efficiency. Let’s dive in and understand how this powerful tool can help you streamline processes and improve your underwriting outcomes.
What is an Underwriting Efficiency KPI Dashboard?
An Underwriting Efficiency KPI Dashboard is a tool that allows businesses to track and assess their underwriting performance. The dashboard offers a comprehensive view of various metrics or KPIs, such as approval rates, underwriting turnaround times, and more. By analyzing these KPIs, businesses can gain valuable insights into their underwriting processes, identify bottlenecks, and make data-driven decisions to enhance efficiency.
The Underwriting Efficiency KPI Dashboard in Excel is designed to track and analyze key metrics using clear, actionable data. Whether you are in insurance, banking, or financial services, this dashboard can help you monitor your underwriting team’s performance and uncover areas for improvement.
Key Features of the Underwriting Efficiency KPI Dashboard in Excel
The Underwriting Efficiency KPI Dashboard offers seven essential worksheets, each serving a unique purpose to provide you with detailed insights into your underwriting operations. Here’s an overview of the features:
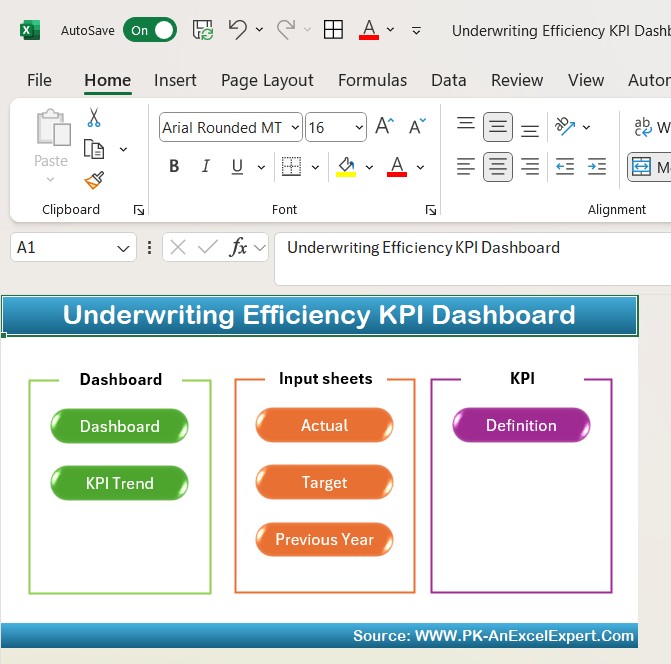
Home Sheet: This is the central hub of the dashboard, providing links to all other sheets. You can jump to any section with the click of a button, making navigation smooth and straightforward.
Click to buy Underwriting Efficiency KPI Dashboard in Excel
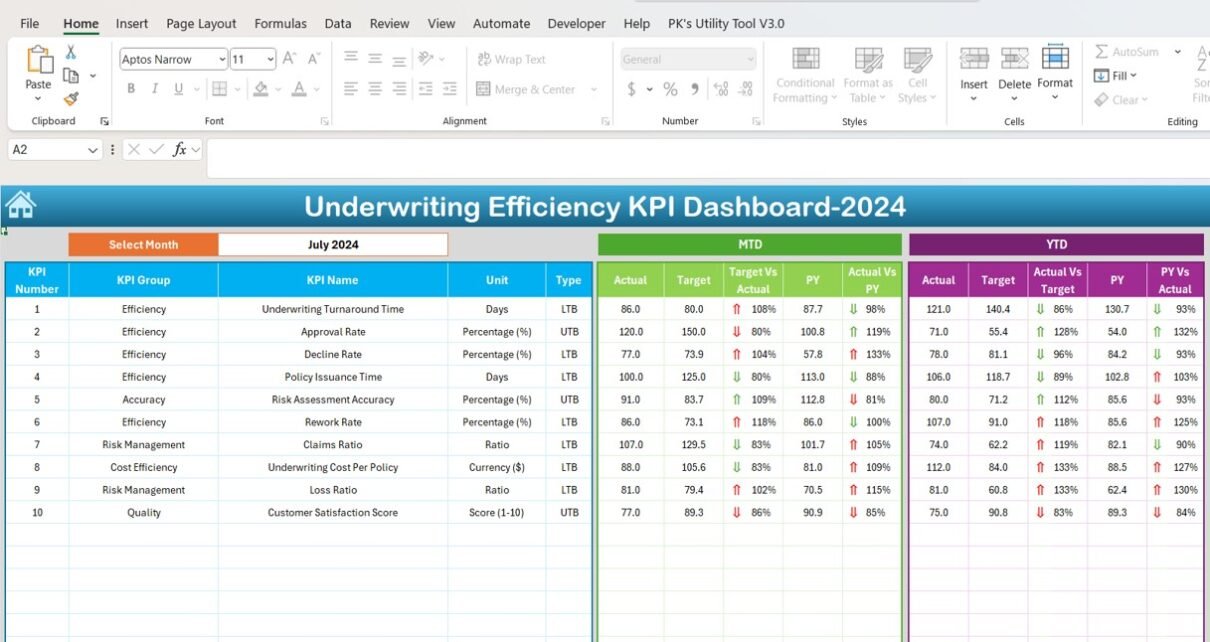
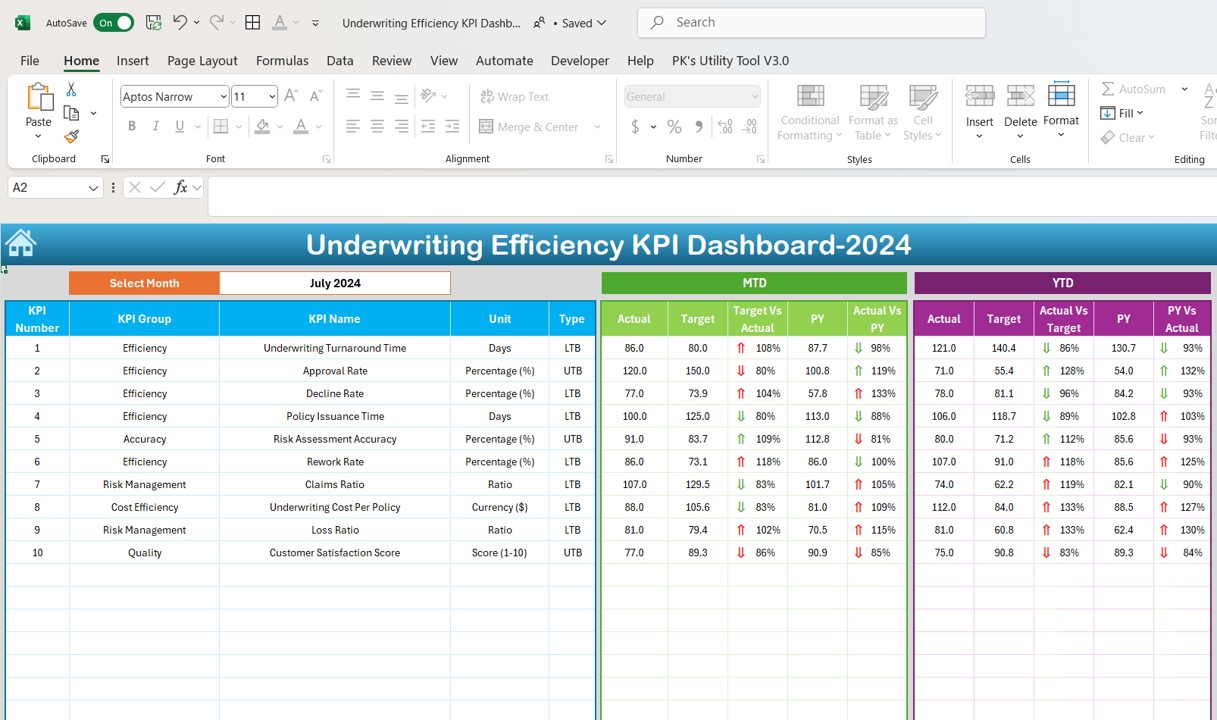
Dashboard Sheet Tab: The heart of the dashboard. This sheet displays a wide range of KPIs, including MTD (Month-to-Date), YTD (Year-to-Date) data, and targets. It uses conditional formatting with up and down arrows to visually highlight the performance status.
Click to buy Underwriting Efficiency KPI Dashboard in Excel
KPI Trend Sheet Tab: This tab helps track the performance of specific KPIs over time. You can choose a KPI from the dropdown menu, and the sheet will display its KPI group, unit, formula, and definition. It also indicates whether a higher or lower value is better.
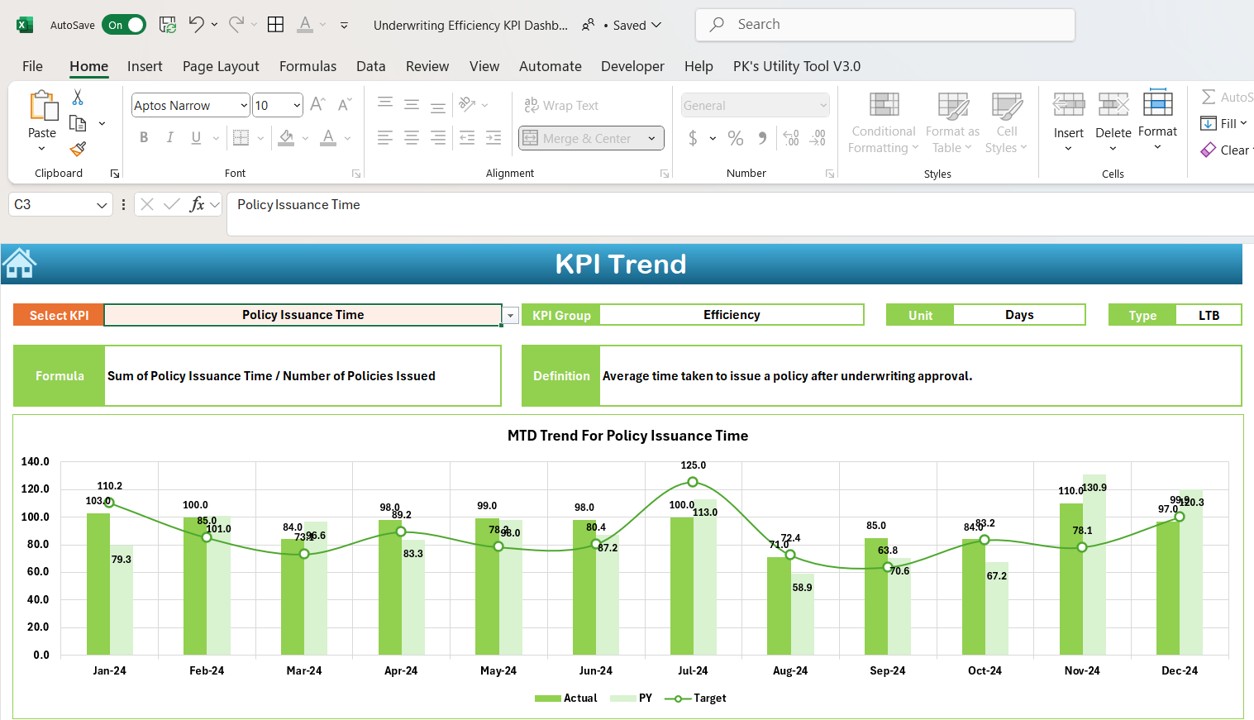
Click to buy Underwriting Efficiency KPI Dashboard in Excel
Actual Numbers Sheet Tab: Enter the actual values for YTD and MTD here. The sheet will update according to the month selected, providing you with real-time data for your KPIs.
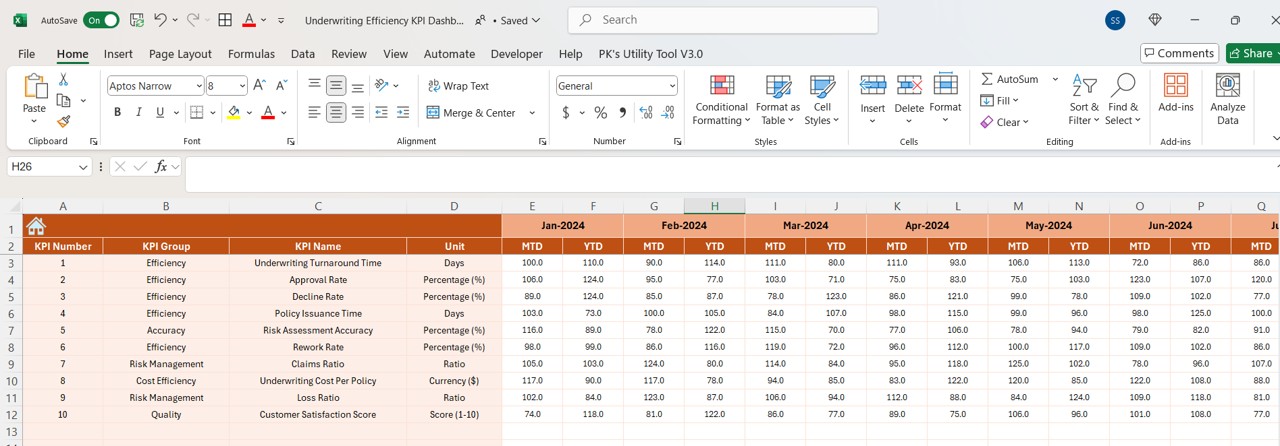
Click to buy Underwriting Efficiency KPI Dashboard in Excel
Target Sheet Tab: Enter the target values for each KPI, both for MTD and YTD. These targets will be compared to the actual numbers in the dashboard to evaluate performance.
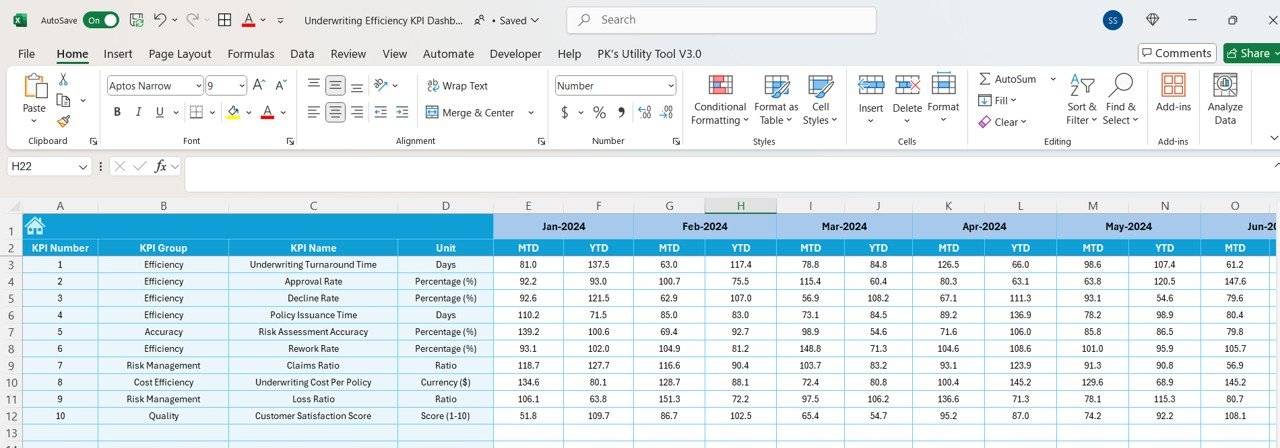
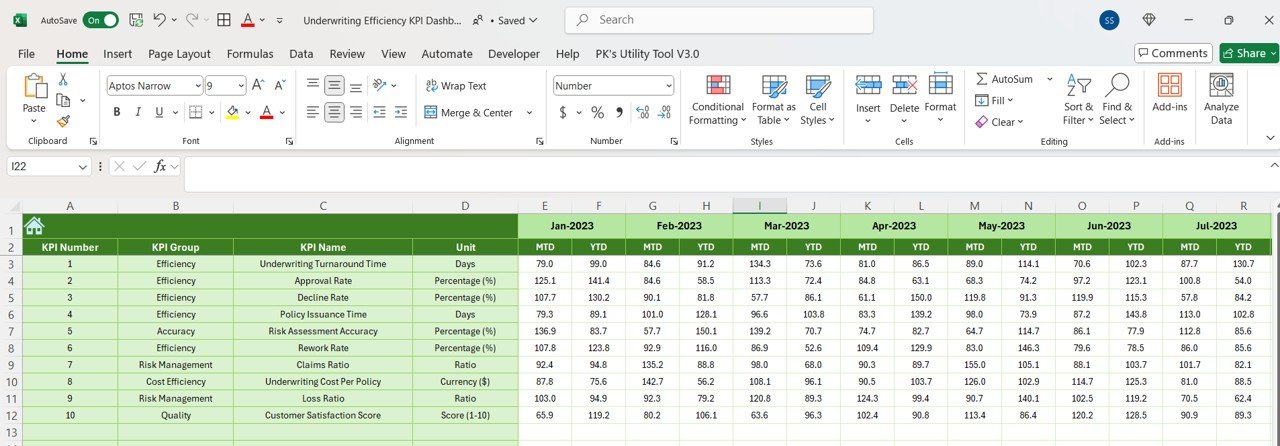
Previous Year Numbers Sheet Tab: In this tab, input the data for the previous year, enabling a comparison of the current year’s performance with historical data.
Click to buy Underwriting Efficiency KPI Dashboard in Excel
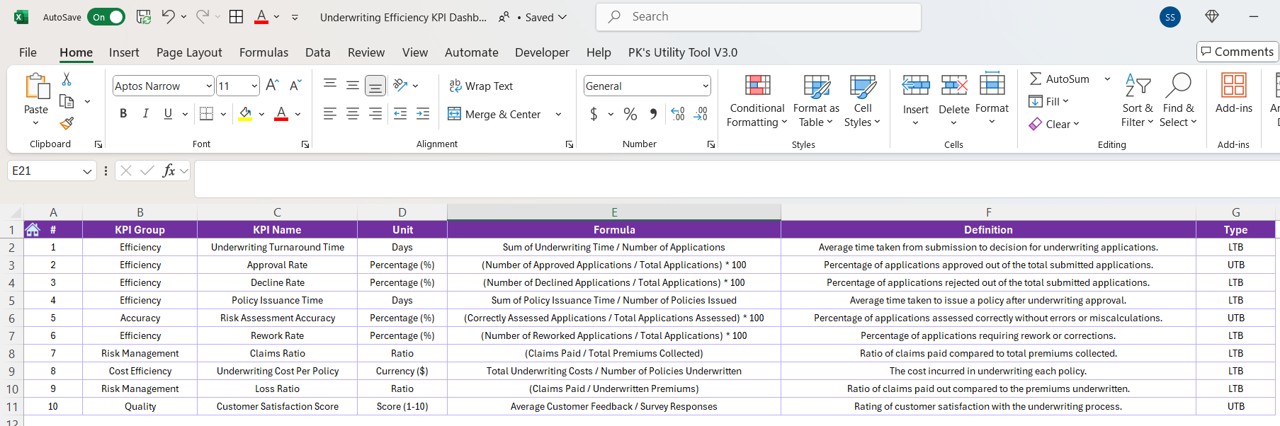
KPI Definition Sheet Tab: This sheet contains all the key information about the KPIs, including the KPI name, group, unit, formula, and definition. It serves as a reference for understanding each metric.
Click to buy Underwriting Efficiency KPI Dashboard in Excel
Click to buy Underwriting Efficiency KPI Dashboard in Excel
Advantages of the Underwriting Efficiency KPI Dashboard in Excel
Using the Underwriting Efficiency KPI Dashboard in Excel offers several advantages:
- Centralized Data Management: The dashboard allows you to input, track, and compare multiple underwriting metrics in one centralized location. It simplifies data management and ensures that everyone involved in the underwriting process has access to the same information.
- Real-Time Tracking of KPIs: With real-time updates for MTD, YTD, and previous year data, the dashboard enables you to monitor underwriting performance as it happens. This helps in making timely decisions and identifying inefficiencies before they become larger issues.
- Comparative Analysis: The dashboard compares your underwriting results with target numbers and previous year data. This enables you to quickly assess whether the underwriting process is improving, stagnating, or deteriorating.
- Improved Decision-Making: Having access to critical underwriting data allows managers to make informed decisions. They can identify trends, analyze performance, and strategize improvements based on real data.
- Enhanced Efficiency; By tracking key metrics such as underwriting turnaround time, approval rate, and decline rate, the dashboard helps identify inefficiencies. This allows your team to take corrective actions, streamline processes, and boost underwriting efficiency.
Opportunity for Improvement in Underwriting Efficiency
Click to buy Underwriting Efficiency KPI Dashboard in Excel
While the Underwriting Efficiency KPI Dashboard is an incredibly powerful tool, there is always room for improvement. Here are some areas where you can refine your underwriting process further:
- Automation of Data Entry: Currently, the dashboard requires manual entry of actual numbers, targets, and previous year data. Automating this data input through integrations with other systems or data sources could save time and reduce errors.
- Incorporation of Predictive Analytics; Incorporating predictive analytics into the dashboard could help forecast future underwriting performance. Using historical data, you could predict future trends and proactively address potential inefficiencies.
- Expanding KPIs: While the dashboard tracks key metrics, it can be enhanced by adding more KPIs to give a deeper insight into underwriting performance. Consider adding metrics like customer satisfaction, underwriting quality, or policy conversion rates to broaden your analysis.
Best Practices for Using the Underwriting Efficiency KPI Dashboard
To get the most out of your Underwriting Efficiency KPI Dashboard, here are some best practices to follow:
- Regularly Update the Data: To ensure accurate and actionable insights, it’s essential to update the actual numbers and targets regularly. Set a schedule for updating data, such as monthly or quarterly, to maintain the relevance of the dashboard.
- Use Conditional Formatting Wisely: Conditional formatting in the dashboard is a powerful tool for visualizing performance. Ensure that it’s used consistently and effectively, so key trends are easily identifiable.
- Leverage Comparative Analysis: Regularly compare current data with targets and previous year data to spot trends. This will help you determine if performance is on track or if adjustments are needed.
- Train Your Team: Ensure that everyone who will use the dashboard understands how to read and interpret the data. Providing training on the dashboard’s features and KPIs will improve overall efficiency and help with faster decision-making.
Conclusion
Click to buy Underwriting Efficiency KPI Dashboard in Excel
The Underwriting Efficiency KPI Dashboard in Excel is a must-have tool for insurance, banking, and financial services businesses looking to improve their underwriting processes. By providing real-time tracking of essential KPIs and offering insights into efficiency, the dashboard empowers managers and teams to optimize performance. With its user-friendly design and customizable features, this Excel-based tool is ideal for businesses of all sizes aiming to improve their underwriting efficiency.
Frequently Asked Questions with Answers
What is an Underwriting Efficiency KPI Dashboard?
An Underwriting Efficiency KPI Dashboard is a tool that helps track and measure key performance indicators (KPIs) related to the underwriting process. It provides insights into underwriting turnaround time, approval rates, policy issuance time, and other crucial metrics.
How can the Underwriting Efficiency KPI Dashboard improve underwriting performance?
By tracking KPIs like turnaround time, approval rate, and decline rate, the dashboard identifies inefficiencies in the underwriting process. This enables businesses to streamline operations, make informed decisions, and improve overall efficiency.
What are the key features of the Underwriting Efficiency KPI Dashboard in Excel?
The key features include a home sheet for navigation, a dashboard sheet for KPI display, a KPI trend sheet, and separate sheets for actual numbers, targets, and previous year data. The dashboard also provides KPI definitions, formulas, and units of measurement.
Can the Underwriting Efficiency KPI Dashboard be customized?
Yes, the dashboard is highly customizable. You can add or modify KPIs, adjust target values, and input data for specific months. It’s flexible to meet the specific needs of your underwriting process.
How can I make the most of the Underwriting Efficiency KPI Dashboard?
To maximize the value of the dashboard, regularly update the data, use conditional formatting for visual clarity, and perform regular comparative analysis with targets and previous year data.
Visit our YouTube channel to learn step-by-step video tutorials
Watch the step-by-step video Demo:
Click to buy Underwriting Efficiency KPI Dashboard in Excel