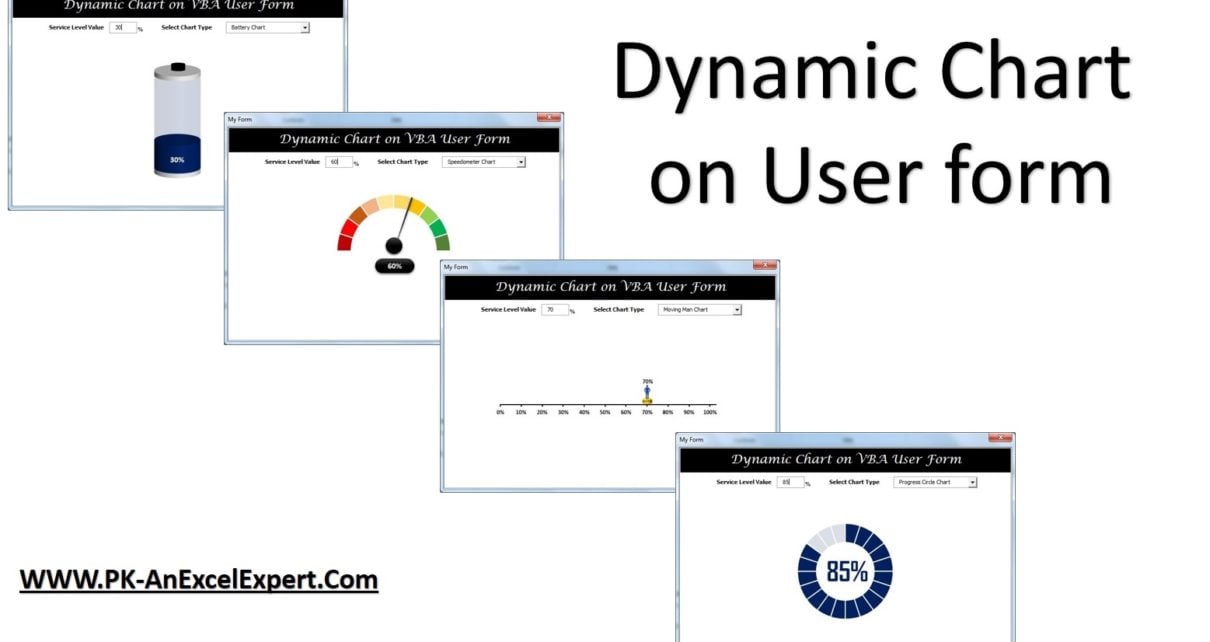
Creating the Chart on a VBA user form is quite interesting. We have created 4 KPI Charts – Battery Chart, Speedometer Chart, Moving Man Chart and Progress Circle Chart on a User form which is fully dynamic. This is ready to use template for Dynamic Chart on User Form.
Dynamic Chart on User Form
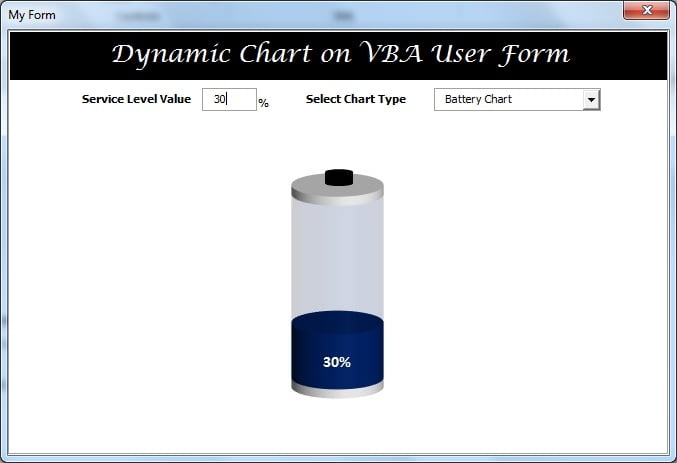
KPI value is connected with a Textbox. As soon as the text box value will be changed chart will show the updated number.
We have also given the Change chart type drop-down. KPI Chart can be changed using this drop-down.
Below the image of Battery Chart:
Click to buy Dynamic Chart on User Form
Below the image of Speedometer Chart:
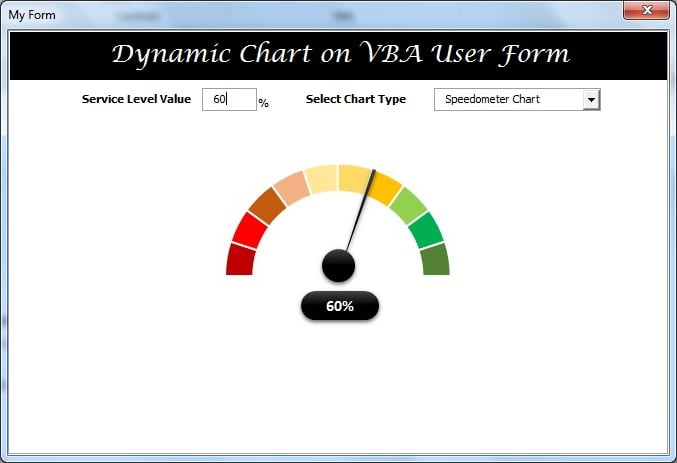
Click to buy Dynamic Chart on User Form
Below the image of Moving Man Chart:
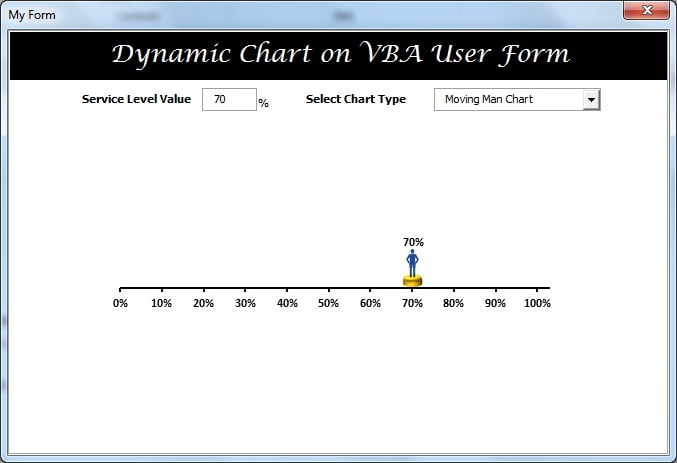
Click to buy Dynamic Chart on User Form
Below the image of Progress Circle Chart:
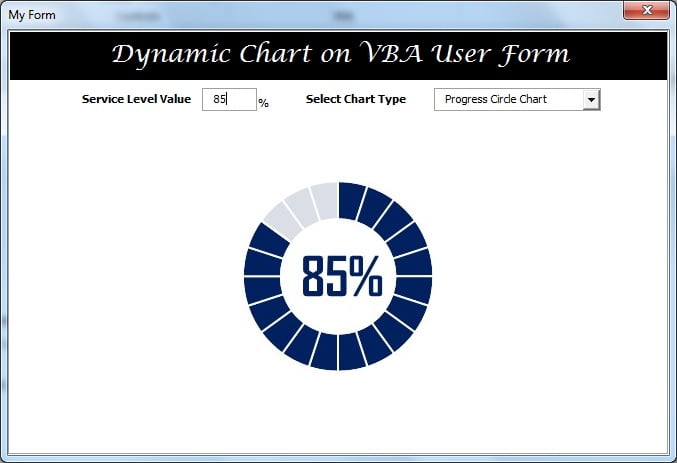
Click to buy Dynamic Chart on User Form
Visit our YouTube channel to learn step-by-step video tutorials
Watch the step-by-step video tutorial:
Click to buy Dynamic Chart on User Form