Warehouse management is a crucial part of any supply chain, ensuring seamless inventory tracking, optimizing storage, and improving operational efficiency. But how do businesses measure and improve warehouse performance? The answer lies in Warehouse Management KPI Dashboards in Power BI—a powerful tool that provides real-time insights into key performance indicators (KPIs).
This article will explore how you can use Power BI to create a Warehouse Management KPI Dashboard, its key features, advantages, and best practices to maximize its potential.
Click to Warehouse Management KPI
What is a Warehouse Management KPI Dashboard?
A Warehouse Management KPI Dashboard is a visual representation of essential warehouse performance metrics. It helps managers track inventory movement, order accuracy, fulfillment rates, stock levels, and operational efficiency at a glance. By integrating Power BI with Excel, businesses can create interactive dashboards that update dynamically, ensuring data-driven decision-making.
Key Features of the Warehouse Management KPI Dashboard in Power BI
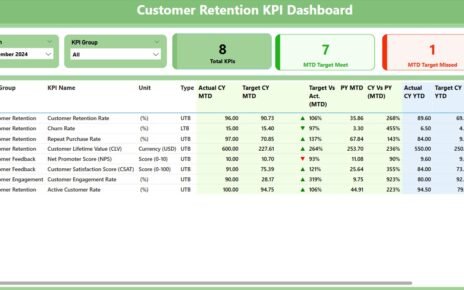
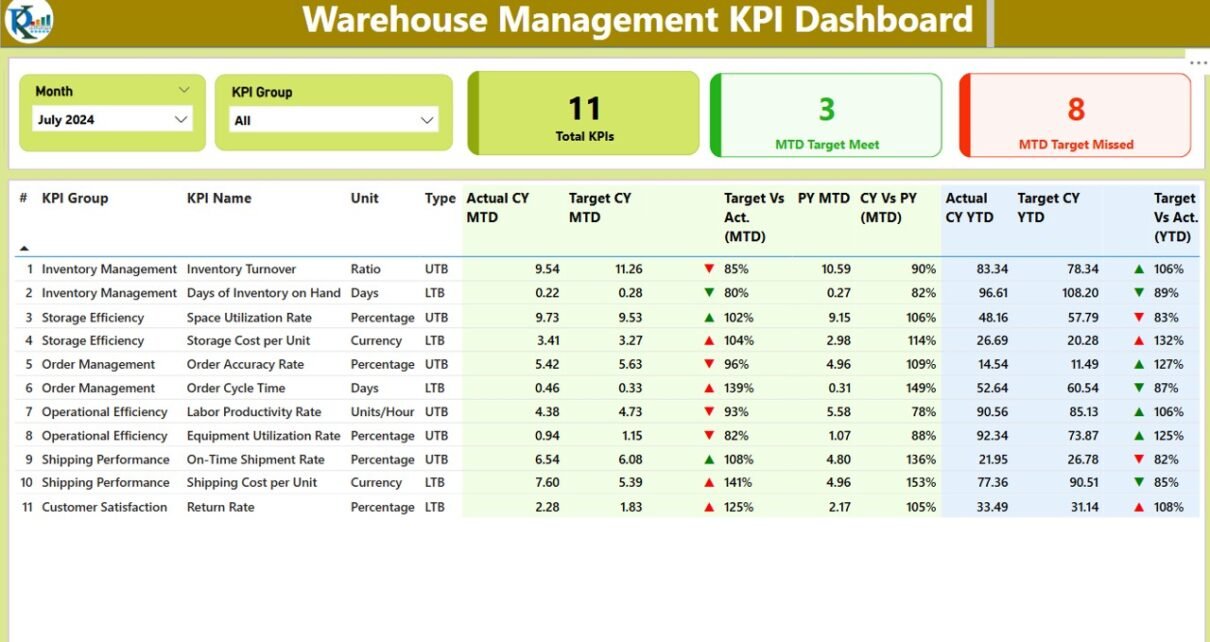
Summary Page: The Control Center of Your Dashboard
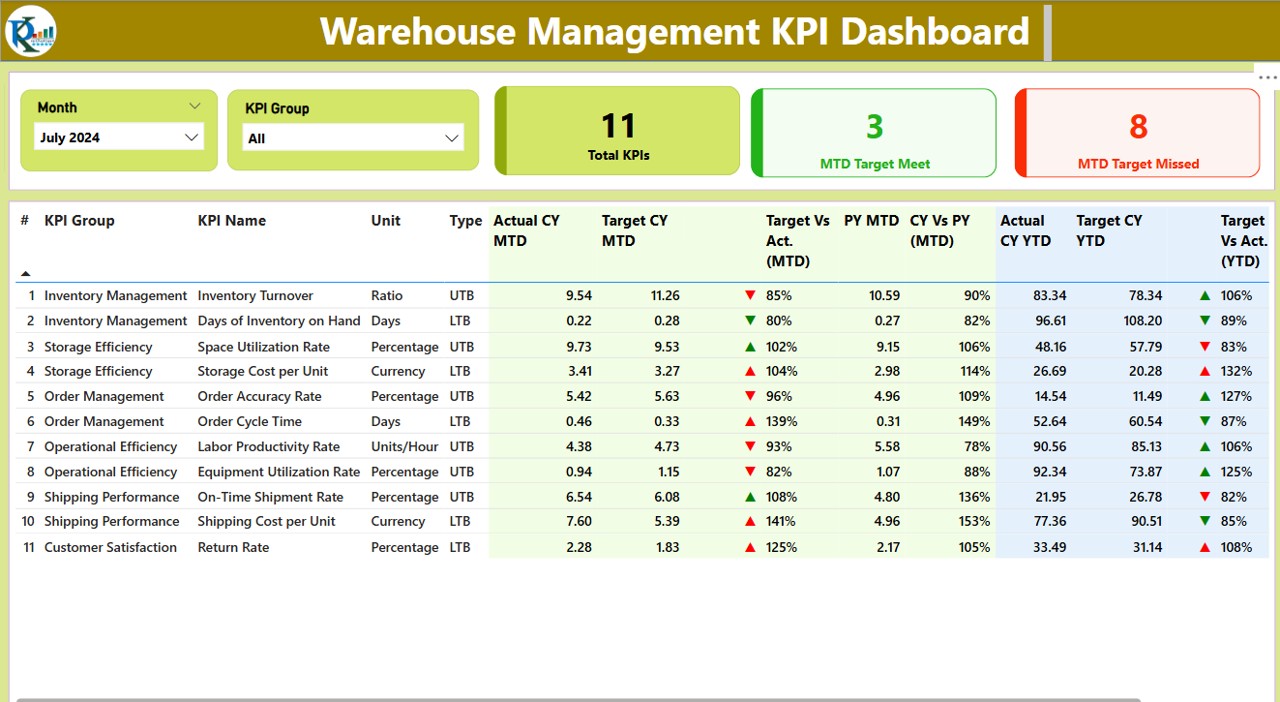
The Summary Page is the main dashboard interface, giving users an overview of warehouse performance. It includes:
- KPI Group Slicer: Allows users to filter data based on different KPI categories.
Three Key Metrics Cards:
- Total KPI Count
- MTD (Month-to-Date) Target Met Count
- MTD Target Missed Count
- Detailed KPI Table displaying:
- KPI Number (Sequence Number of KPI)
- KPI Group (Category of KPI)
- KPI Name (Metric being measured)
- Unit of Measurement
- KPI Type (Lower The Better (LTB) or Upper The Better (UTB))
- Actual CY MTD (Current Year Month-to-Date)
- Target CY MTD (Month-to-Date Goal)
- MTD Icon (Green ▲ for Met, Red ▼ for Missed)
- Target vs. Actual (MTD Percentage)
- Previous Year MTD for Comparison
- Actual CY YTD (Year-to-Date Current Year Data)
- Target CY YTD (Year-to-Date Target Data)
- YTD Icon (Green ▲ for Met, Red ▼ for Missed)
- Target vs. Actual (YTD Percentage)
- Previous Year YTD for Comparison
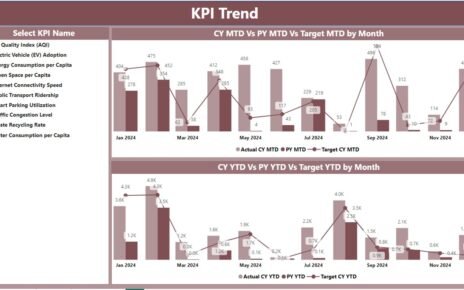
KPI Trend Page: Analyzing Trends Over Time
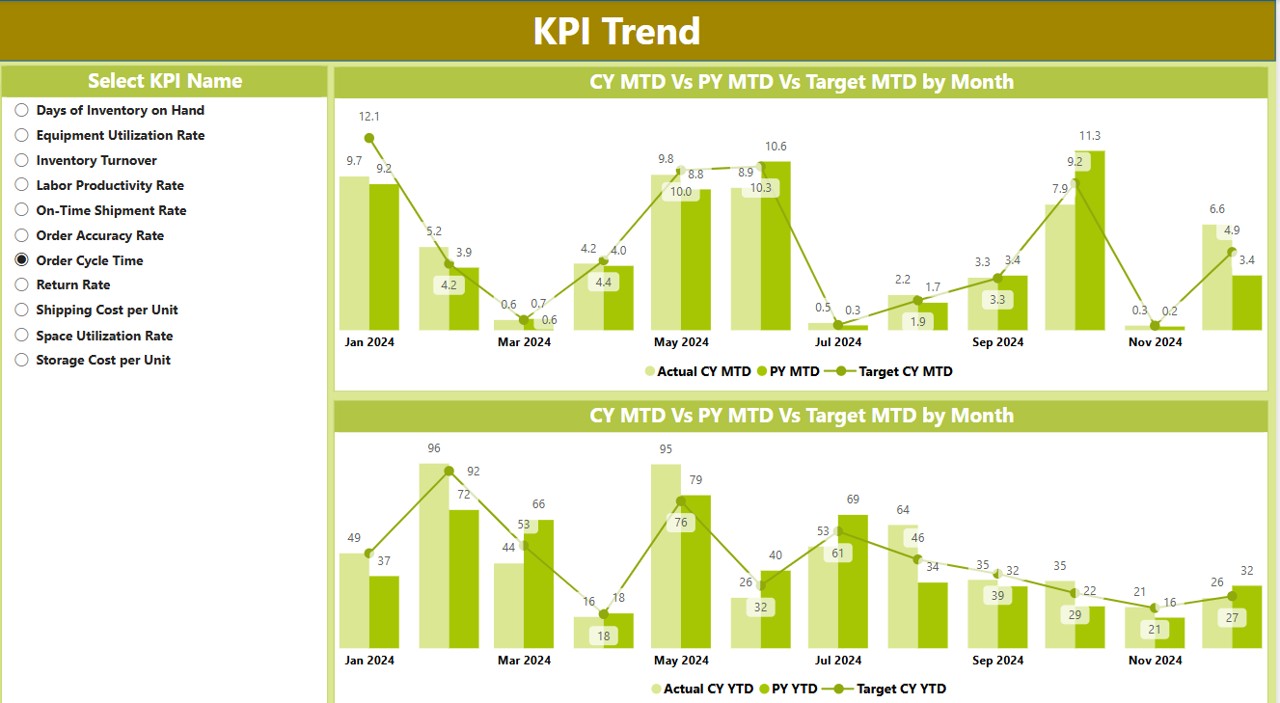
- This page provides valuable insights into trends and patterns, allowing businesses to:
- Compare Current Year, Previous Year, and Target MTD/YTD numbers.
- Utilize a slicer to select a specific KPI for detailed analysis.
- View two combo charts displaying actual vs. target numbers over time.
KPI Definition Page: Understanding the KPIs
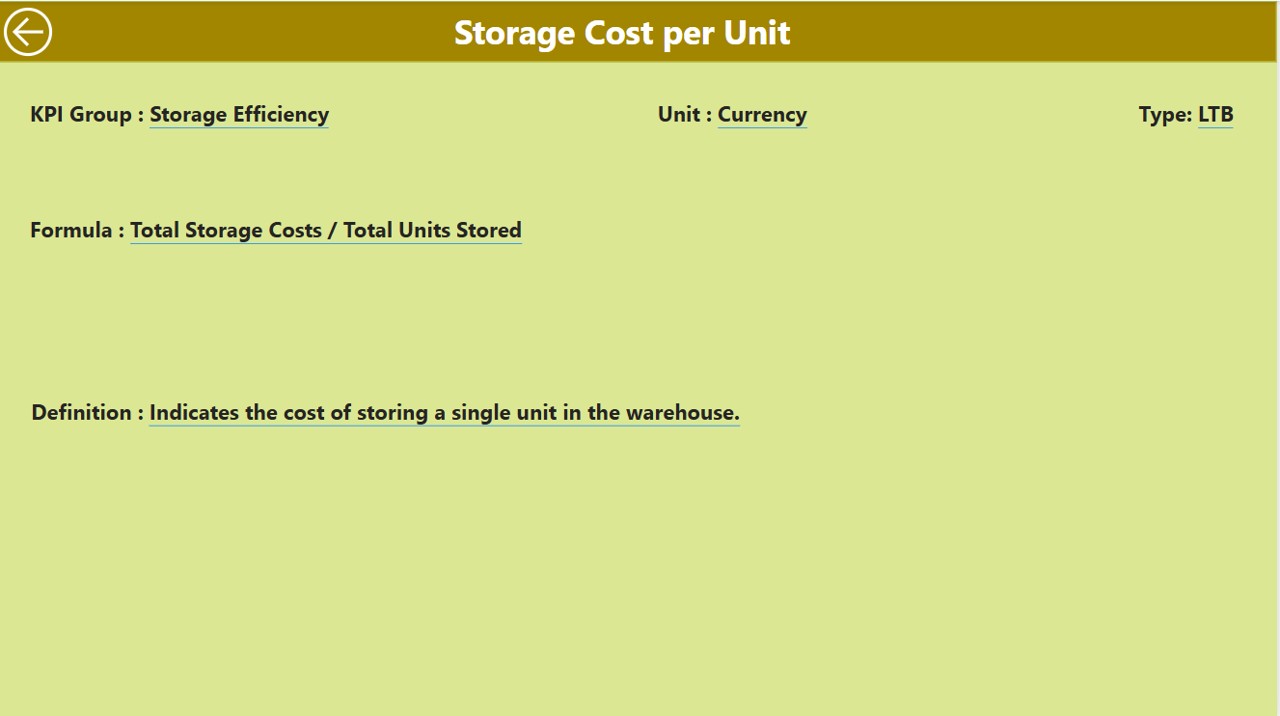
- This hidden drill-through page provides detailed definitions and formulas for each KPI. Users can:
- Drill through from the Summary Page to view the KPI formula and detailed definition.
- Click the back button on the top left corner to return to the main page.
Click to Warehouse Management KPI
How Data is Captured in the Dashboard
- The Warehouse Management KPI Dashboard sources data from an Excel file that feeds into Power BI. Users must update three sheets:
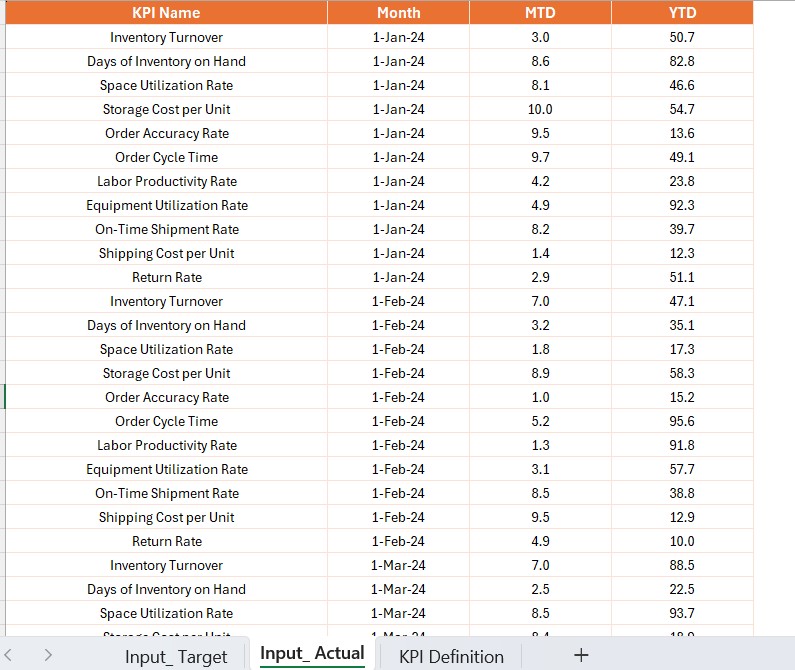
Input Actual Sheet:
- Fill in KPI names, months, MTD, and YTD actual numbers.
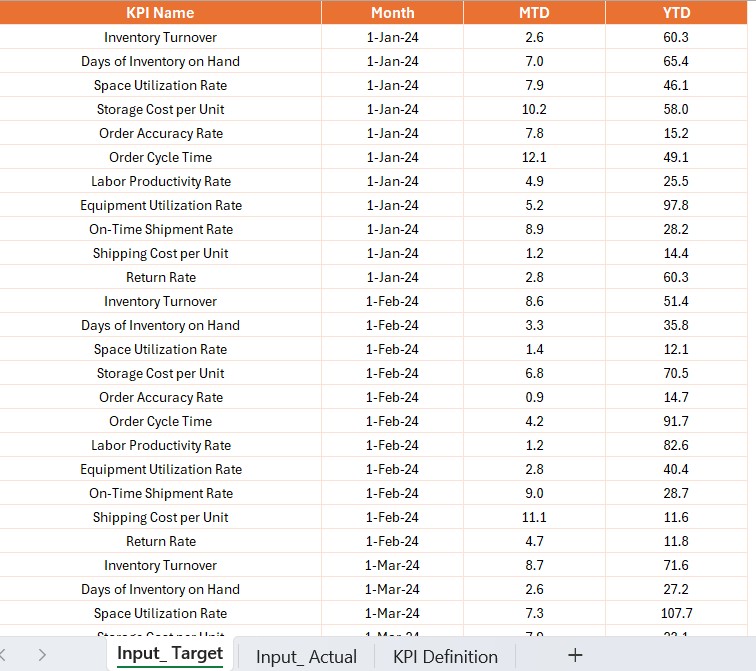
Input Target Sheet:
- Enter target values for the same KPIs.
KPI Definition Sheet:
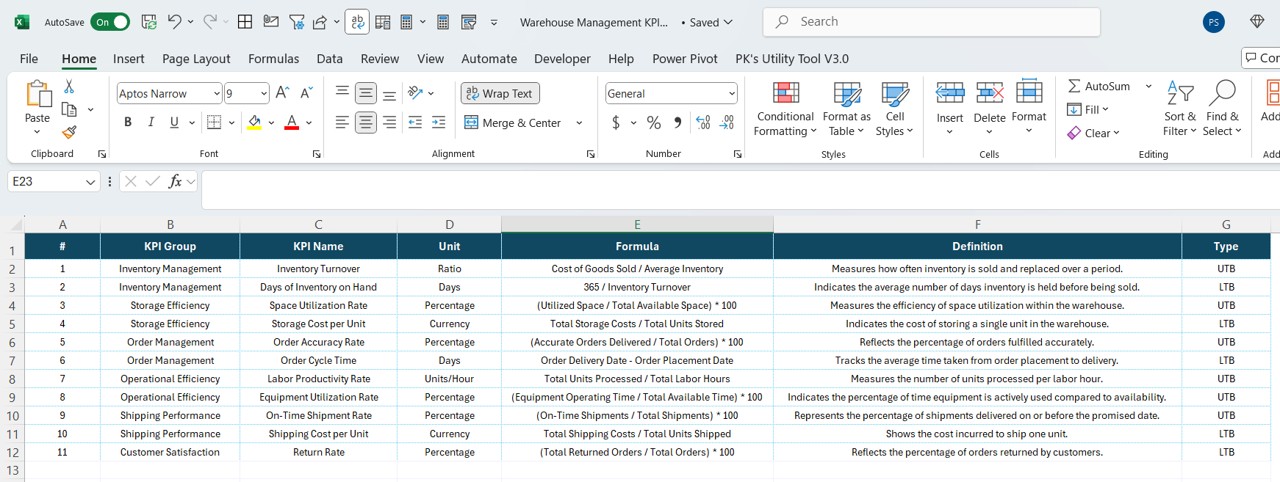
- Define KPI numbers, groups, names, units, formulas, definitions, and types (LTB/UTB).
- With this structure, businesses can dynamically update their data and analyze real-time trends.
Advantages of Using a Warehouse KPI Dashboard in Power BI
- Real-Time Performance Monitoring
Gain instant insights into warehouse efficiency, allowing managers to take immediate action.
Dynamic & Interactive Analysis
Users can filter, drill-down, and customize views to analyze warehouse performance at different levels.
Data-Driven Decision Making
Improve warehouse operations by making informed decisions based on historical and real-time data.
Saves Time and Reduces Manual Errors
Eliminates manual reporting by integrating automated data updates from Excel into Power BI.
Improves KPI Tracking and Benchmarking
Compare current performance vs. past trends to ensure continuous process optimization.
Click to Warehouse Management KPI
Best Practices for an Effective Warehouse KPI Dashboard
- Keep the Interface Clean & User-Friendly: Avoid clutter and display only essential KPIs.
- Use Color Coding for KPI Status: Green for achieved targets, red for underperformance.
- Ensure Data Accuracy: Regularly update Excel sheets to reflect real-time values.
- Enable Drill-Through for Deeper Insights: Allow users to view definitions and formulas.
- Integrate Forecasting Models: Use Power BI’s AI-driven analytics to predict warehouse performance.
- Leverage Data Slicers & Filters: Enhance interactivity and allow users to customize their view.
Conclusion
A Warehouse Management KPI Dashboard in Power BI is an essential tool for any business looking to improve efficiency, reduce operational bottlenecks, and make data-driven decisions. By leveraging Power BI’s interactive capabilities, users can analyze warehouse performance in real time, track trends, and ensure continuous process improvements.
Frequently Asked Questions (FAQs)
What are the most important KPIs for warehouse management?
Some crucial KPIs include Inventory Turnover, Order Accuracy, Warehouse Capacity Utilization, Receiving Cycle Time, and On-Time Shipments.
Can I integrate this Power BI dashboard with other data sources?
Yes! You can connect Power BI with ERP systems, databases, and cloud storage solutions to automate data updates.
How often should I update my warehouse KPI dashboard?
For real-time tracking, update data daily or weekly. However, some businesses prefer monthly updates for trend analysis.
What is the benefit of using Power BI over Excel for warehouse KPIs?
Power BI offers interactive dashboards, drill-through analysis, automated updates, and AI-driven insights, making it far superior to static Excel reports.
Is Power BI suitable for small businesses?
Absolutely! Power BI scales easily, and even small businesses can benefit from its real-time analytics and cost-effective solutions.
Final Thoughts
Implementing a Warehouse Management KPI Dashboard in Power BI can revolutionize your warehouse operations by improving efficiency, accuracy, and decision-making. Start building your Power BI dashboard today and gain actionable insights into your warehouse performance!
Click to Warehouse Management KPI
Visit our YouTube channel to learn step-by-step video tutorials
View this post on Instagram