In today’s business environment, sustainability is more than just a buzzword—it is an essential practice for companies looking to optimize operations and minimize waste. Measuring waste reduction is crucial for organizations striving to improve efficiency and meet sustainability goals. A Waste Reduction KPI Dashboard in Excel provides a structured and automated way to track, analyze, and report key waste reduction metrics.
This article will walk you through a ready-to-use Waste Reduction KPI Dashboard, detailing its key features, advantages, and best practices for effective use.
Click to Waste Reduction KPI
What is a Waste Reduction KPI Dashboard?
A Waste Reduction KPI Dashboard is an Excel-based tool designed to track and visualize key performance indicators (KPIs) related to waste management and reduction. It provides a comprehensive view of waste-related metrics, enabling organizations to make data-driven decisions and optimize resource utilization.
Key Features of the Waste Reduction KPI Dashboard
This dashboard is structured with seven worksheets, each serving a specific purpose:
Click to Waste Reduction KPI
Home Sheet
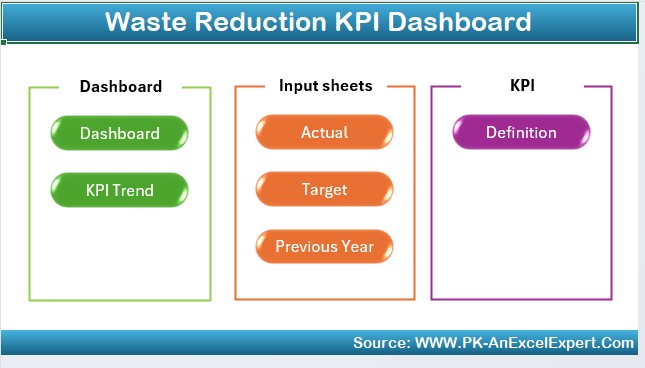
- Acts as an index page with six navigation buttons to jump to respective sheets.
- Provides a structured interface for easy access to relevant data.
Dashboard Sheet Tab
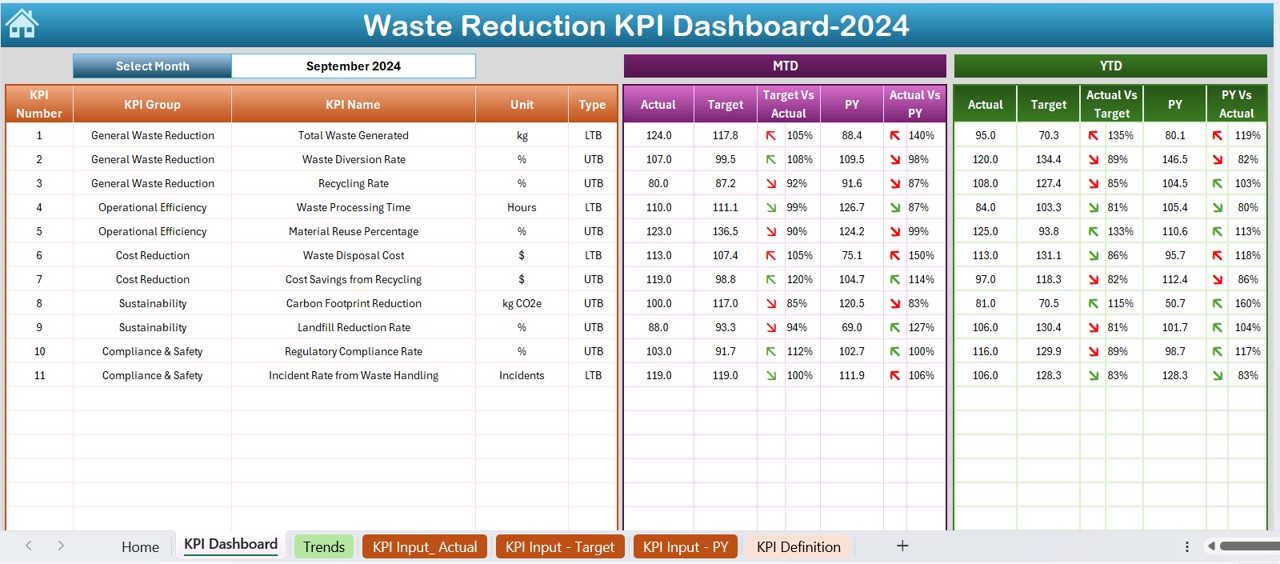
- Main visualization sheet displaying all KPIs.
- Users can select a month from the drop-down in cell D3, and the dashboard updates dynamically.
- Displays MTD (Month-to-Date) and YTD (Year-to-Date) Actual vs. Target values.
- Conditional formatting highlights up/down arrows for trend analysis.
KPI Trend Sheet Tab
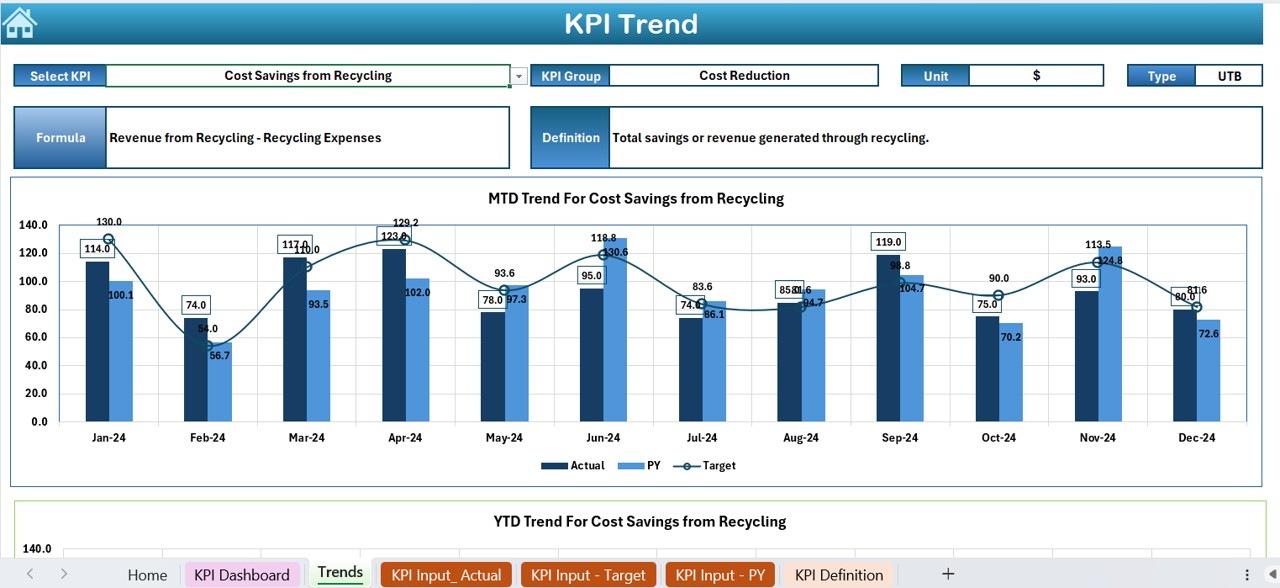
- Select a KPI from the drop-down in cell C3 to view details.
- Displays KPI Group, Unit, Type (Lower is Better or Upper is Better), Formula, and Definition.
- Trend charts for MTD, YTD, Actual, Target, and Previous Year (PY) values.
Click to Waste Reduction KPI
Actual Numbers Input Sheet
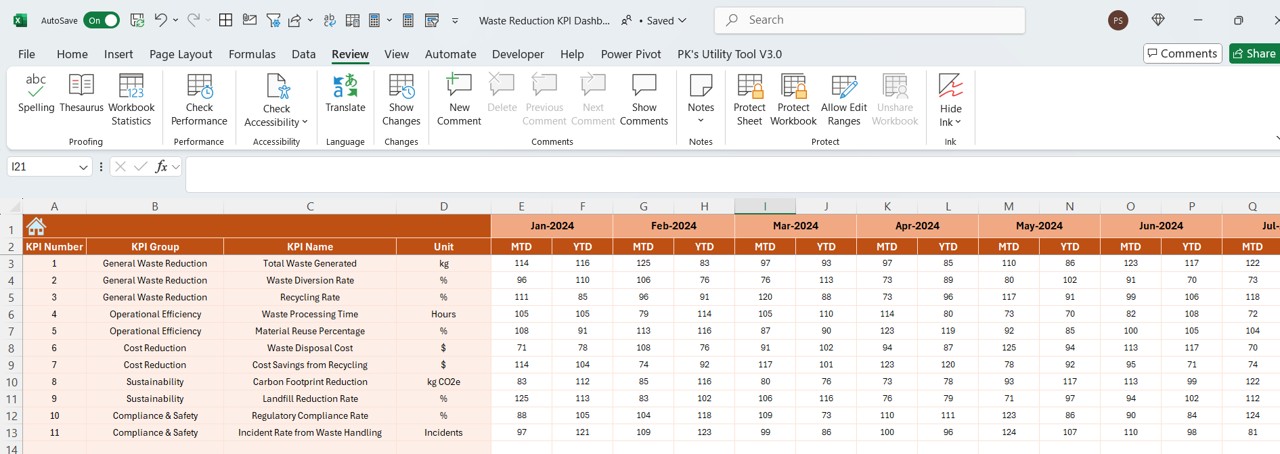
- Users enter actual MTD and YTD numbers for a selected month.
- The selected month can be changed using cell E1.
Target Sheet Tab
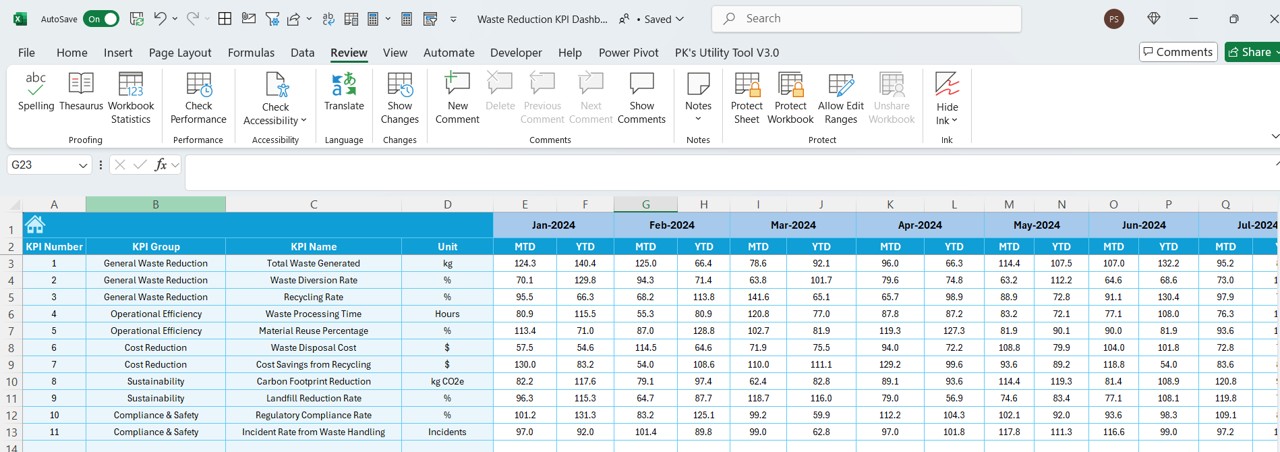
- Users enter the target numbers for each KPI for MTD and YTD.
Previous Year Numbers Sheet Tab
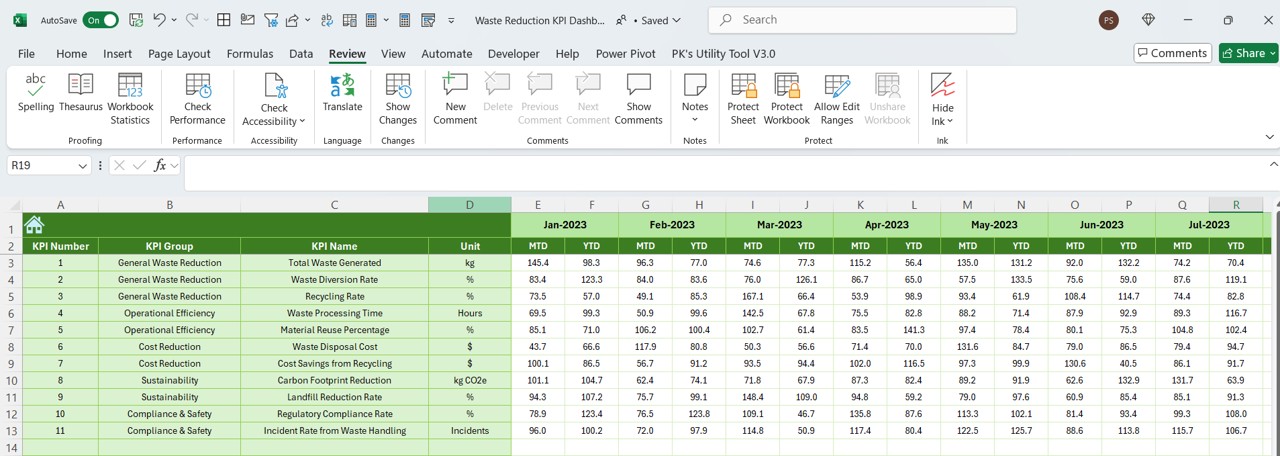
- Contains actual numbers from the previous year for comparison.
KPI Definition Sheet Tab
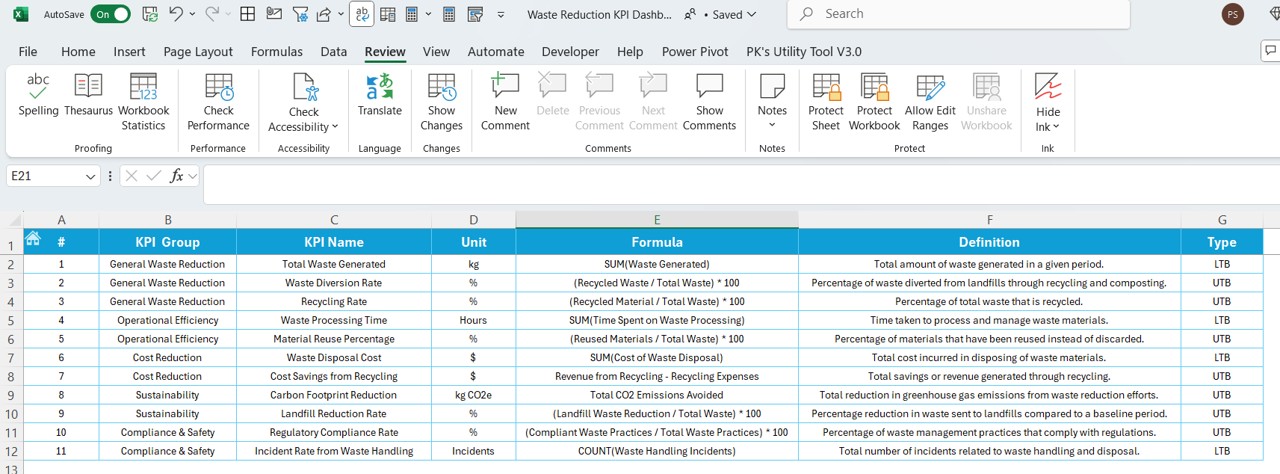
- Houses all KPI details including KPI Name, Group, Unit, Formula, and Definition.
Advantages of a Waste Reduction KPI Dashboard
- Data-Driven Decision Making: The dashboard automates KPI tracking, reducing manual errors and ensuring accurate reporting.
- Real-Time Monitoring: Users can select any month and instantly view trends and comparisons.
- Better Performance Analysis: Helps organizations track waste reduction efforts over time, ensuring sustainability goals are met.
- Customization & Flexibility: Since the dashboard is built in Excel, users can modify it as needed to include additional KPIs or filters.
- Identify Trends & Anomalies: Conditional formatting highlights performance gaps, helping users take corrective action.
Click to Waste Reduction KPI
Best Practices for Using the Waste Reduction KPI Dashboard
- Define Clear KPI Targets: Before using the dashboard, ensure that waste reduction targets are well-defined and realistic.
- Regular Data Updates: To maintain accuracy, input actual and target data monthly.
- Monitor KPI Trends Consistently: Use the KPI Trend Sheet to identify patterns and improvement areas.
- Leverage Conditional Formatting: Pay attention to up/down arrows, which indicate performance shifts.
- Use Data to Drive Sustainability Initiatives: Act on insights gained from the dashboard to implement better waste reduction strategies.
Conclusion
A Waste Reduction KPI Dashboard in Excel is a powerful tool for businesses aiming to track, measure, and optimize their waste management efforts. By leveraging this dashboard, organizations can enhance efficiency, meet sustainability targets, and contribute to a greener environment.
Frequently Asked Questions (FAQs)
What is a Waste Reduction KPI?
A Waste Reduction KPI is a measurable metric used to track an organization’s progress in minimizing waste production and optimizing resource usage.
How does the Excel dashboard help in waste reduction?
The dashboard automates data tracking and visualization, allowing users to monitor trends and identify areas needing improvement.
Can I customize the KPI Dashboard?
Yes! Since it is built in Excel, you can modify the dashboard to include additional metrics, filters, and visualizations.
Is the KPI Dashboard suitable for all industries?
Absolutely! Manufacturing, retail, healthcare, and logistics can all benefit from tracking waste reduction KPIs.
How often should I update the dashboard?
It is recommended to update MTD and YTD numbers every month to maintain accurate reporting.
Click to Waste Reduction KPI
Visit our YouTube channel to learn step-by-step video tutorials
View this post on Instagram