In today’s fast-paced world, managing and tracking water production efficiently is essential for utilities and organizations in the water industry. One of the most effective ways to monitor water production is through a comprehensive KPI (Key Performance Indicator) dashboard in Excel. In this article, we will dive deep into the Water Production KPI Dashboard in Excel, covering all the KPIs you need to monitor, their formulas, definitions, and more.
If you’re looking to keep your water production operations smooth, a reliable and easy-to-use dashboard can be a game-changer. The Water Production KPI Dashboard in Excel offers a ready-to-use solution with all the key metrics and analytics in one place. Whether you are tracking production efficiency, water treatment costs, energy consumption, or water wastage, this dashboard has got you covered.
Key Features of the Water Production KPI Dashboard in Excel
This dynamic dashboard comes with 7 essential worksheets, each serving a unique purpose to help you analyze, track, and improve your water production process:
Home Sheet Tab
The home tab is your central hub. With just a click, you can jump to any of the other tabs, streamlining navigation.

Click to buy Water Production KPI Dashboard in Excel
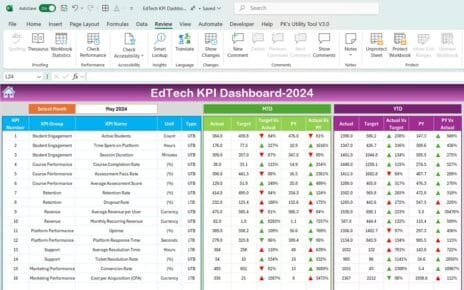
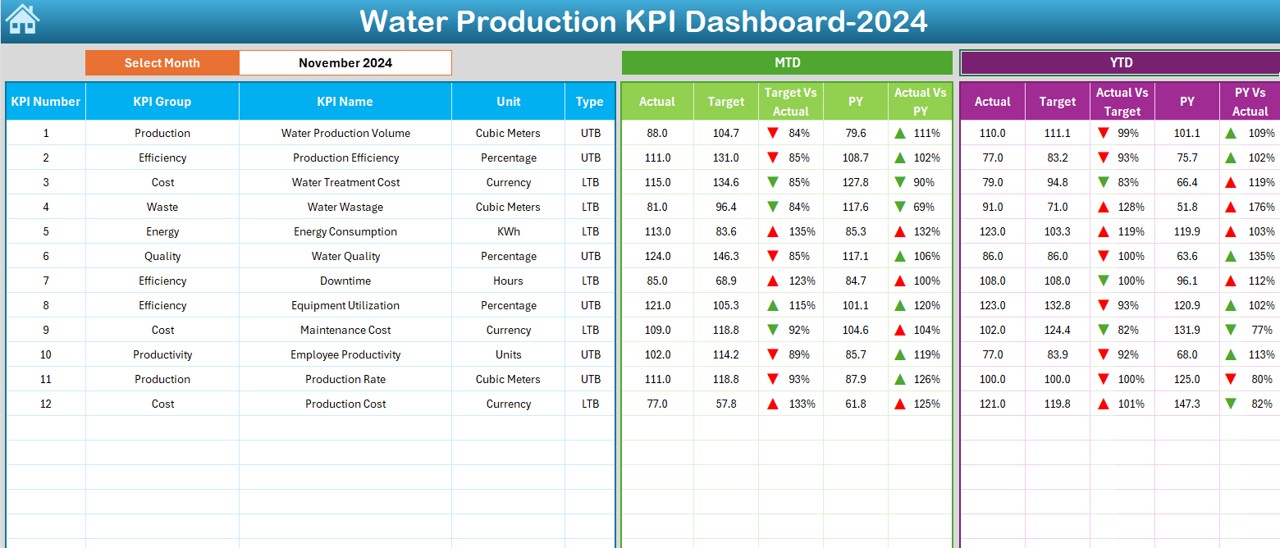
Dashboard Sheet Tab
The heart of the Water Production KPI Dashboard, this sheet provides a detailed view of your KPIs. The dashboard offers a range of metrics, including:
- MTD Actual vs. Target
- YTD Actual vs. Target
- Previous Year Data
- Conditional Formatting: To help you visualize performance, we use up and down arrows for quick insights.
Click to buy Water Production KPI Dashboard in Excel
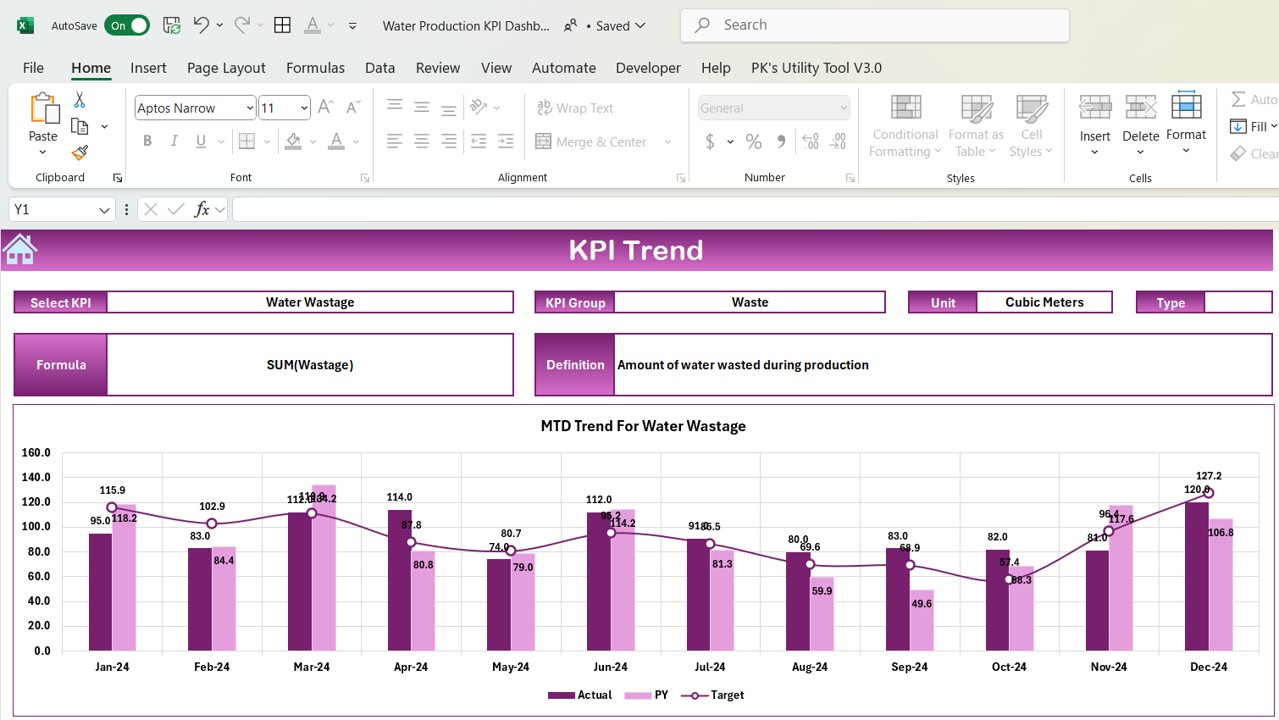
KPI Trend Sheet Tab
This sheet allows you to track trends over time. Select the KPI name from the dropdown in Range C3, and you’ll see the KPI group, unit, type, formula, and definition of the selected KPI.
Click to buy Water Production KPI Dashboard in Excel
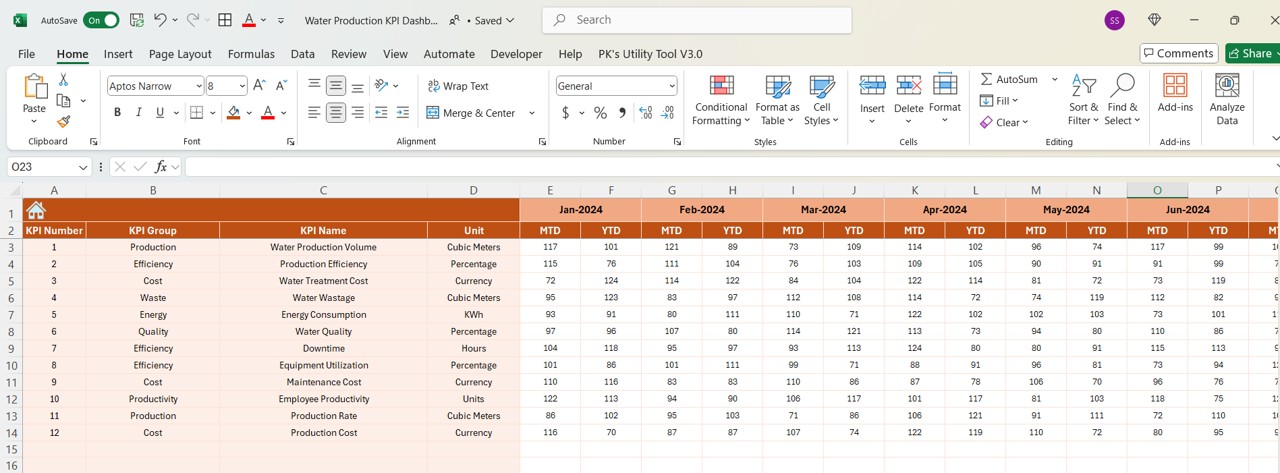
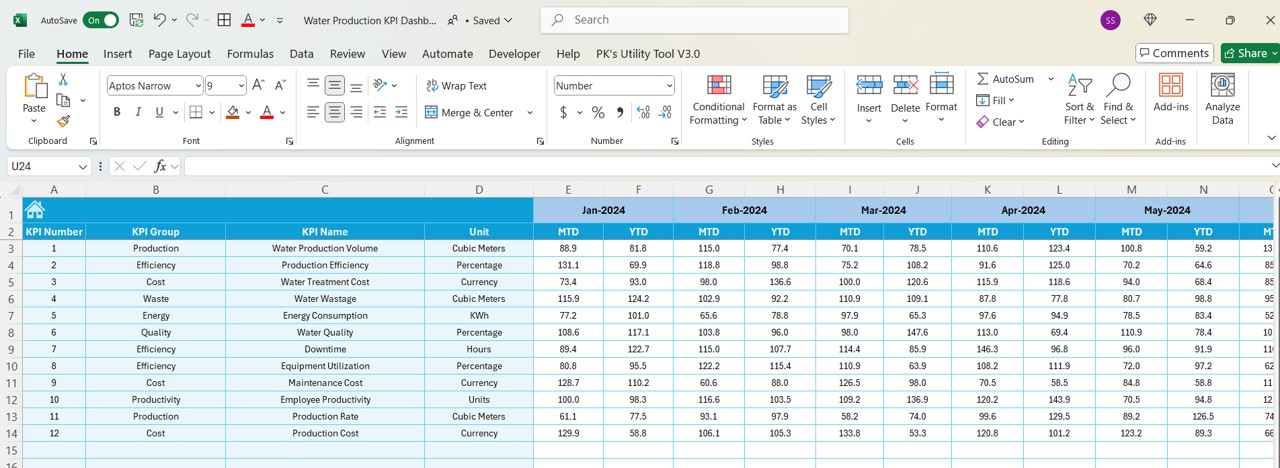
Actual Number Sheet Tab
Here, you can input the actual numbers for both YTD (Year-to-Date) and MTD (Month-to-Date) for a specific month. By changing the month in Range E1, all data in the dashboard will update accordingly.
Click to buy Water Production KPI Dashboard in Excel
Target Sheet Tab
This sheet lets you input target numbers for each KPI, both for MTD and YTD. This allows you to compare actual performance with the target and make necessary adjustments.
Click to buy Water Production KPI Dashboard in Excel
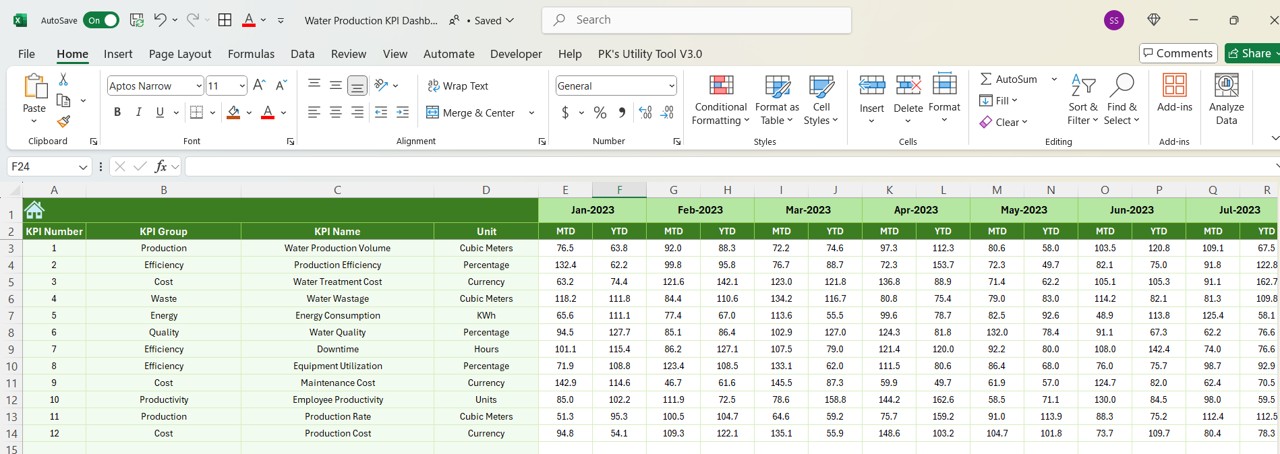
Previous Year Number Sheet Tab
Enter the previous year’s numbers in this tab, making it easy to compare current performance against historical data.
Click to buy Water Production KPI Dashboard in Excel
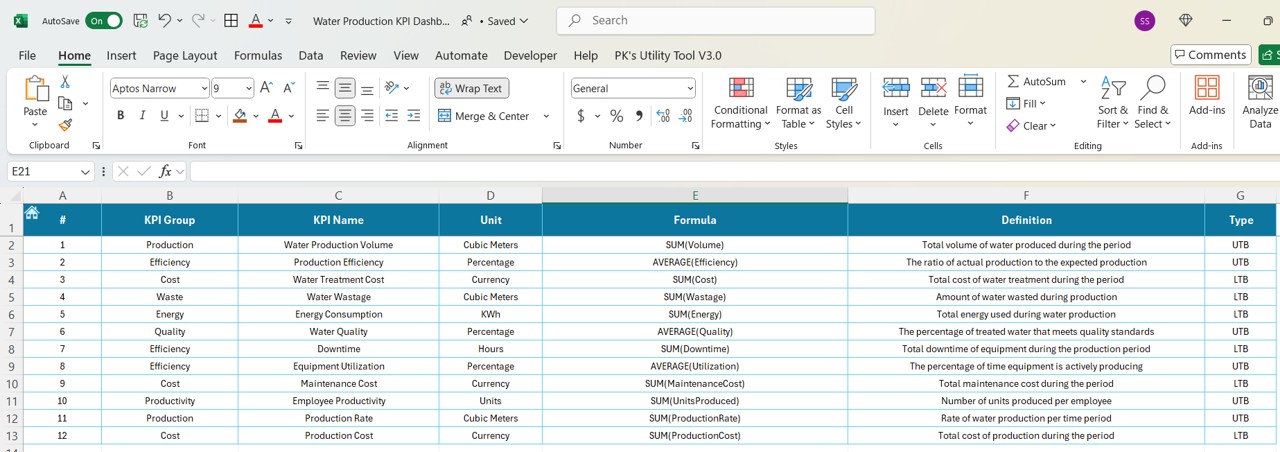
KPI Definition Sheet Tab
The KPI Definition sheet provides a detailed list of all the KPIs, their groupings, units, formulas, and definitions, ensuring everyone on the team is aligned and informed.
Click to buy Water Production KPI Dashboard in Excel
Advantages of the Water Production KPI Dashboard in Excel
The Water Production KPI Dashboard offers several advantages that make it a must-have tool for water production management:
-
Centralized Data Management: All your essential water production data is in one place, making it easier to track and manage performance over time.
-
Real-Time Updates; The dashboard dynamically updates based on the selected month and inputs, ensuring that your data is always current.
-
Easy to Use: With a user-friendly design, even those with minimal Excel experience can quickly adapt to using this dashboard.
-
Customizable; You can tailor the dashboard to your specific needs by adjusting targets, actual numbers, and even adding or removing KPIs as needed.
-
Data Visualization: The use of conditional formatting, arrows, and trend charts makes it easy to identify trends, anomalies, and performance gaps at a glance.
Opportunities for Improvement in the Water Production KPI Dashboard
Click to buy Water Production KPI Dashboard in Excel
While the Water Production KPI Dashboard is already a powerful tool, there are always opportunities to enhance its functionality:
-
Integration with Other Systems: By integrating the dashboard with real-time data sources such as SCADA systems or IoT devices, you can automate data input, eliminating the need for manual updates.
-
Mobile Compatibility: Making the dashboard accessible on mobile devices would allow users to track performance and receive alerts while on the go.
-
Predictive Analytics: Incorporating advanced data analysis features, such as trend forecasting and predictive modeling, could help anticipate future water production challenges and opportunities.
-
User Access Control: Adding role-based access controls would ensure that only authorized personnel can view or modify sensitive data, enhancing security.
Best Practices for Using the Water Production KPI Dashboard
Click to buy Water Production KPI Dashboard in Excel
To get the most out of your Water Production KPI Dashboard, follow these best practices:
-
Regularly Update Data: Ensure that you regularly update both target and actual values in the dashboard to maintain its accuracy and reliability.
-
Set Realistic Targets: Set achievable targets based on historical performance, and update them periodically to reflect any changes in production goals.
-
Use Conditional Formatting: Leverage the conditional formatting features to highlight performance deviations (e.g., red for underperformance, green for targets met).
-
Perform Regular Data Reviews: Conduct monthly or quarterly reviews of the dashboard to assess whether KPIs are aligning with your operational goals and if any adjustments are needed.
-
Share Insights Across Teams: Share the dashboard with key stakeholders to ensure that everyone is aligned and informed about the current state of water production operations.
Frequently Asked Questions (FAQs)
Click to buy Water Production KPI Dashboard in Excel
1. What is the Water Production KPI Dashboard?
The Water Production KPI Dashboard in Excel is a tool designed to help organizations track, manage, and analyze key performance indicators related to water production. It provides real-time insights into performance, efficiency, costs, and waste.
2. How can I use the dashboard to improve water production?
By monitoring the KPIs such as water production volume, treatment costs, and energy consumption, you can identify areas for improvement, set targets, and optimize production processes to enhance efficiency.
3. Can I customize the KPIs in the dashboard?
Yes, you can add or remove KPIs based on your specific needs, making the dashboard highly customizable to suit your water production goals.
4. Is it possible to integrate the dashboard with real-time data?
While the current version of the dashboard requires manual data entry, it can be enhanced by integrating it with real-time data systems to automate data input.
5. How do I interpret the conditional formatting in the dashboard?
The conditional formatting in the dashboard uses color-coded arrows (up or down) to indicate whether the actual performance is above or below the target, making it easy to identify trends at a glance.
Conclusion
Click to buy Water Production KPI Dashboard in Excel
The Water Production KPI Dashboard in Excel is a robust and versatile tool that helps organizations in the water industry track, manage, and improve their water production performance. With its easy-to-use interface and powerful features, it provides valuable insights that can drive operational efficiency and cost reduction. Whether you’re a utility manager, water production analyst, or team lead, this dashboard is an indispensable tool for informed decision-making.
Visit our YouTube channel to learn step-by-step video tutorials