In the competitive world of water sales, managing performance effectively and efficiently is crucial. Whether you’re a water supplier, utility manager, or sales team leader, tracking key metrics helps you understand how your business is performing, identify areas for improvement, and make data-driven decisions. One of the most powerful tools for managing water sales performance is a Water Sales KPI Dashboard in Excel. This comprehensive, ready-to-use template is designed to help you track and analyze your water sales performance with ease.
In this article, we will explore the Water Sales KPI Dashboard in Excel, highlight its key features, and walk you through the KPIs included in the dashboard. Additionally, we’ll cover the advantages, opportunities for improvement, and best practices to get the most out of the dashboard.
Key Features of the Water Sales KPI Dashboard in Excel
This Water Sales KPI Dashboard is a user-friendly tool that allows you to track your water sales performance with just a few clicks. The dashboard comes with 7 essential worksheets, each designed to help you manage and analyze different aspects of your water sales:
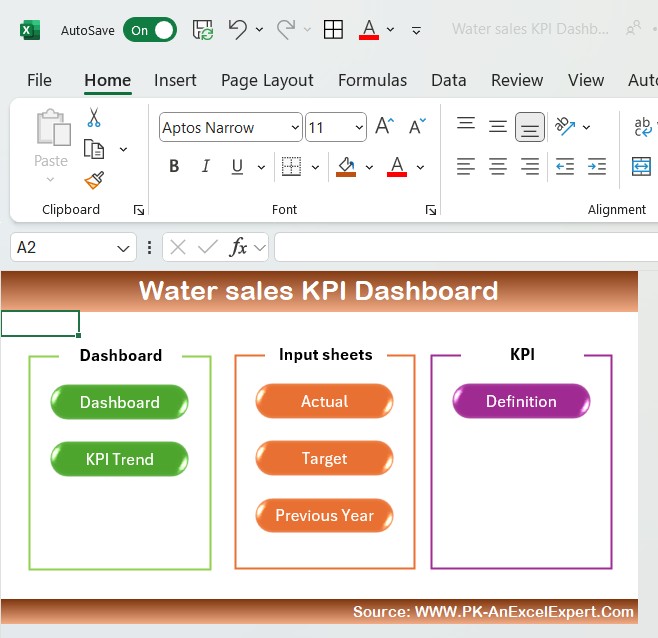
Home Sheet Tab
The Home Sheet serves as your central hub. You can easily navigate to any of the other sheets by clicking on the links provided.
Click to buy Water sales KPI Dashboard in Excel
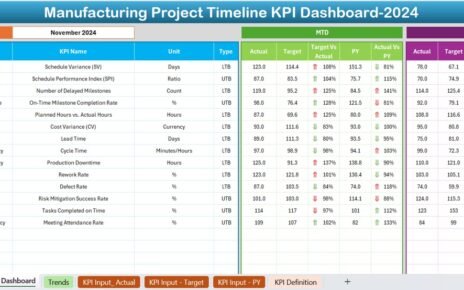
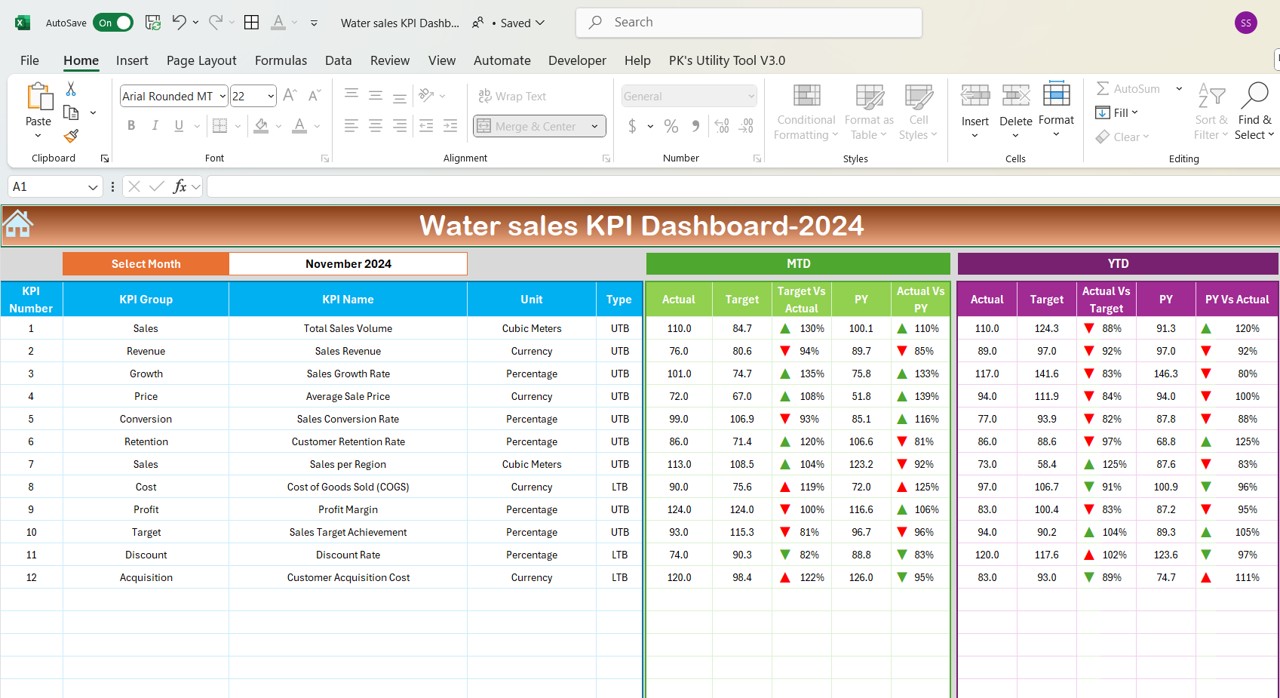
Dashboard Sheet Tab
This is the main sheet where you’ll see all your KPIs. You can select a specific month from the drop-down list in Range D3, and the dashboard will automatically update the numbers for that month. The dashboard shows key metrics like MTD Actuals, Targets, Previous Year Data, and uses conditional formatting to highlight performance gaps with up/down arrows. You’ll also see YTD Actuals and their comparisons to targets and previous year data.
Click to buy Water sales KPI Dashboard in Excel
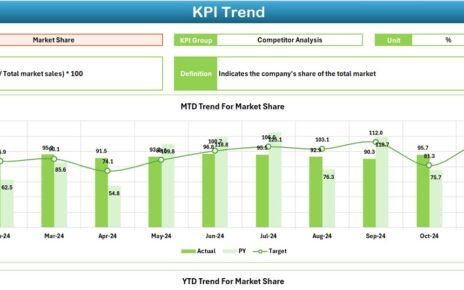
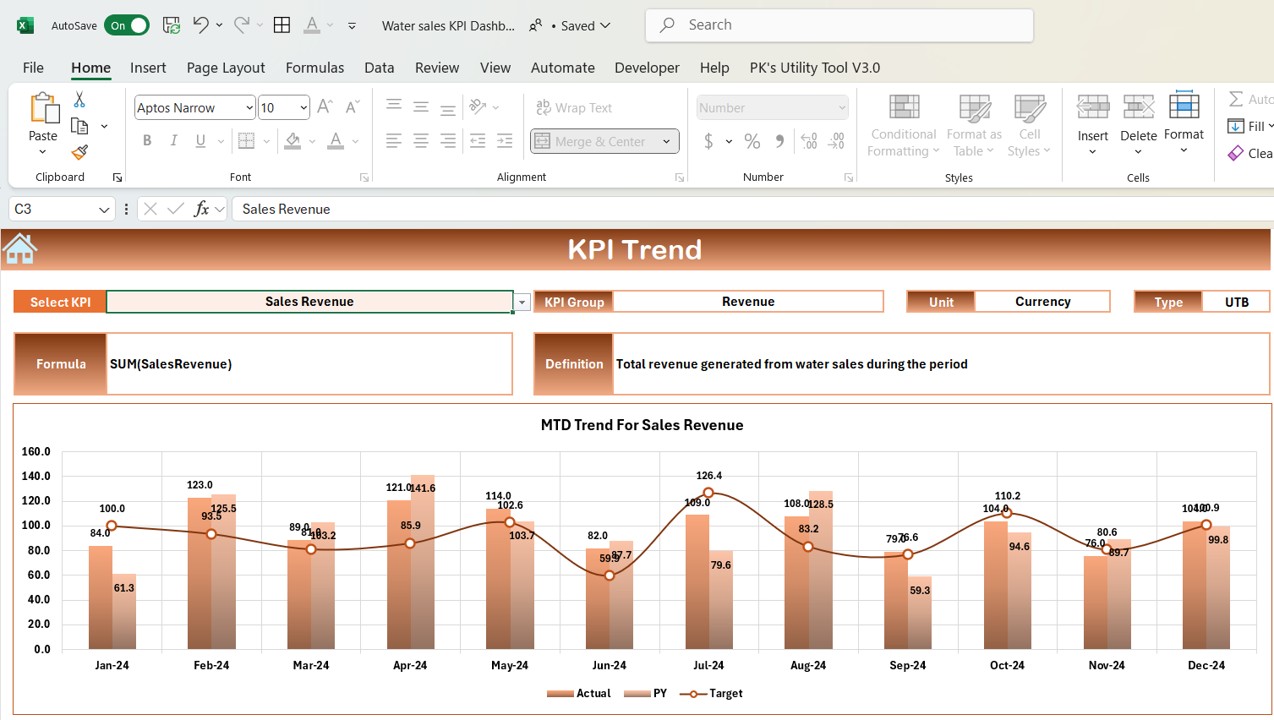
KPI Trend Sheet Tab
The KPI Trend Sheet lets you track the trend of each KPI over time. Select a KPI from the drop-down list in Range C3, and it will display information such as the KPI Group, Unit of Measurement, Type (whether “Lower is Better” or “Upper is Better”), Formula, and Definition.
Click to buy Water sales KPI Dashboard in Excel
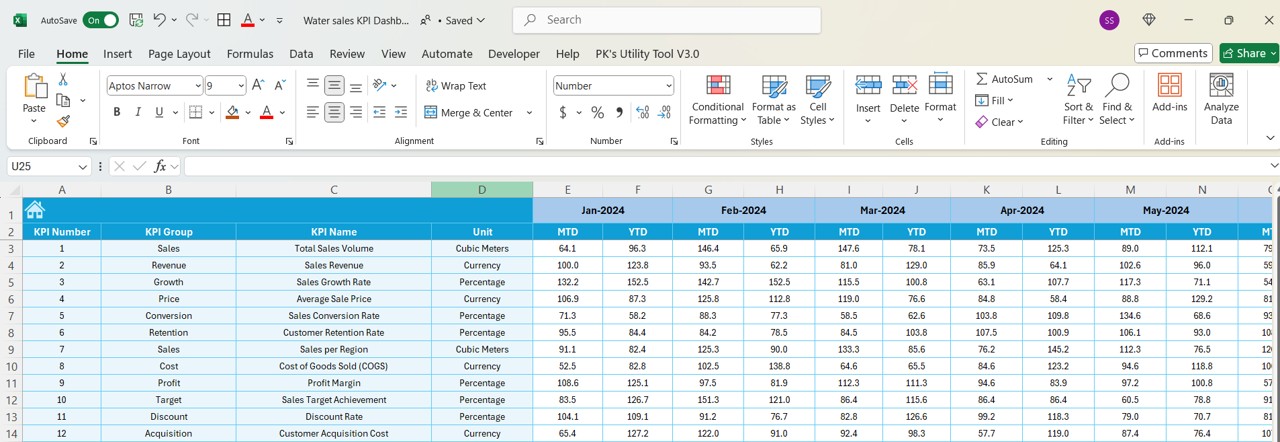
Actual Number Sheet Tab
In this sheet, you can enter the actual numbers for MTD and YTD performance for a specific month. Changing the month in Range E1 will automatically update the dashboard with the new data.

Click to buy Water sales KPI Dashboard in Excel
Target Sheet Tab
This sheet allows you to input the target numbers for each KPI. Enter the MTD and YTD targets, and the dashboard will compare these targets to the actual numbers.
Click to buy Water sales KPI Dashboard in Excel
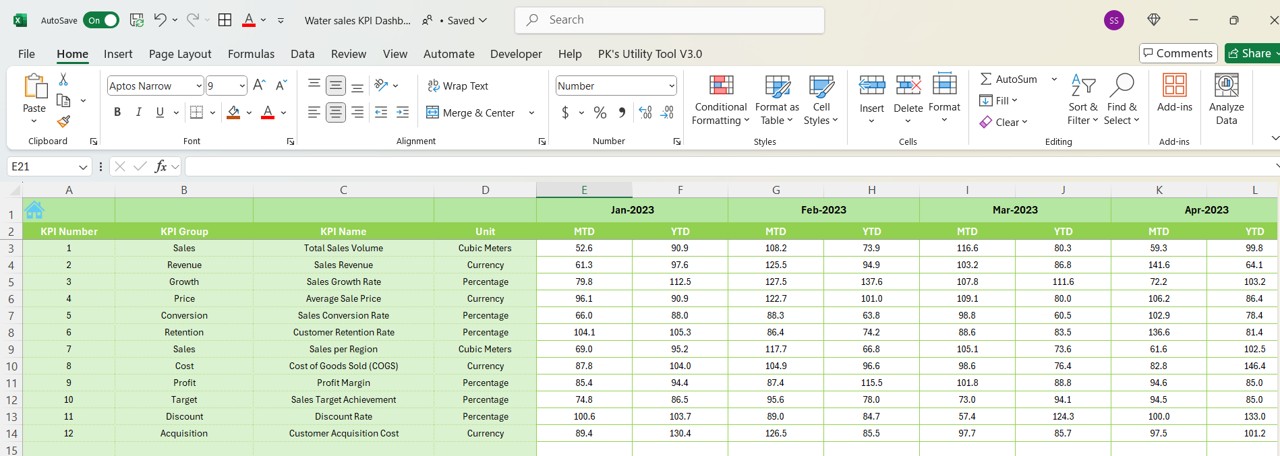
Previous Year Number Sheet Tab
Here, you can enter the sales data from the previous year for comparison. This allows you to track year-over-year performance and see how your sales are improving or declining.
Click to buy Water sales KPI Dashboard in Excel
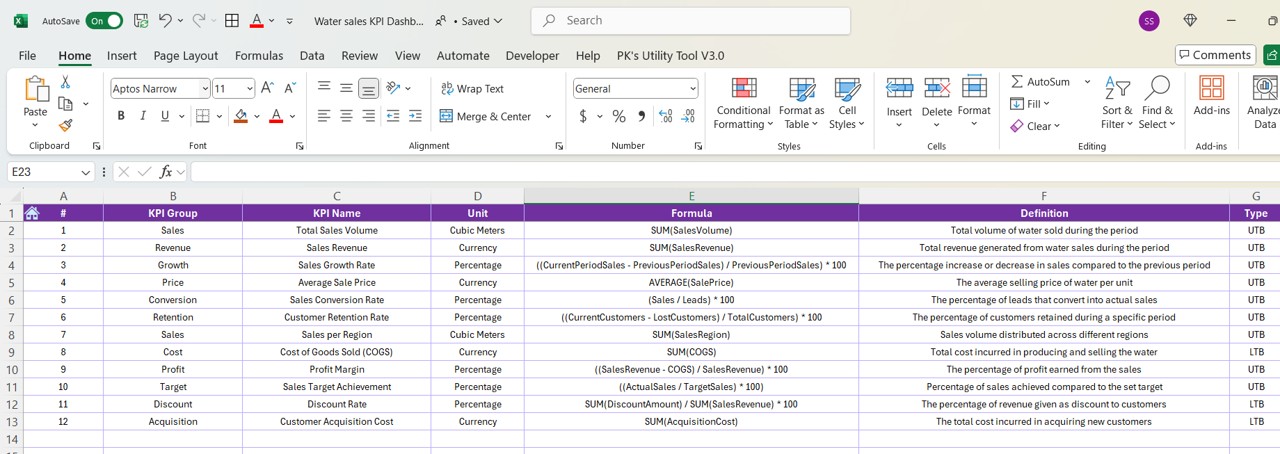
KPI Definition Sheet Tab
The KPI Definition Sheet is where you define the KPIs in detail. You can enter the KPI name, group, unit of measurement, formula for aggregation, and the KPI’s definition.
Click to buy Water sales KPI Dashboard in Excel
Advantages of the Water Sales KPI Dashboard in Excel
The Water Sales KPI Dashboard provides a wide range of benefits, making it an indispensable tool for water sales management. Here are some of the advantages of using this dashboard:
-
Centralized Performance Tracking
The dashboard consolidates all your sales data in one place, allowing you to easily track and compare your performance metrics. -
Real-Time Updates
By simply updating the actual and target values, you can get real-time insights into your sales performance. -
User-Friendly Interface
The dashboard is designed to be intuitive and easy to navigate, making it accessible even to those with minimal Excel experience. -
Data Visualization
The dashboard uses conditional formatting to highlight performance deviations, allowing you to quickly spot areas that need attention. -
Comprehensive KPI Coverage
With KPIs covering sales volume, revenue, customer retention, cost of goods sold, and more, this dashboard provides a complete view of your water sales performance. -
Customizable
You can easily adjust the dashboard to fit your specific business needs by modifying the KPIs, adding new data, or adjusting the layout.
Opportunities for Improvement in the Water Sales KPI Dashboard
While the Water Sales KPI Dashboard is a powerful tool, there are always opportunities to enhance its functionality:
-
Integration with External Data
Integrating the dashboard with real-time data sources such as CRM systems or sales platforms can automate data input and reduce manual entry. -
Mobile Accessibility
Making the dashboard accessible on mobile devices would allow sales teams to view performance data on the go, improving decision-making in real time. -
Advanced Analytics
Adding predictive analytics and trend forecasting features would allow businesses to anticipate future sales patterns and adjust strategies accordingly. -
Role-Based Access
Adding role-based access control would allow managers to restrict or grant access to sensitive data, enhancing security and protecting confidential information.
Best Practices for Using the Water Sales KPI Dashboard
To get the most out of the Water Sales KPI Dashboard, it’s essential to follow best practices:
-
Update Data Regularly
Regularly updating your actual and target numbers will ensure the dashboard remains accurate and useful. -
Set Realistic Targets
Set achievable targets based on historical data and current market trends to make sure the dashboard reflects realistic business goals. -
Leverage Data Visualization
Use the dashboard’s conditional formatting to quickly identify underperformance or overperformance. This helps you take action before problems escalate. -
Perform Data Reviews
Conduct monthly or quarterly reviews of your sales performance to evaluate progress and adjust targets if necessary. -
Share Insights
Share the dashboard with key stakeholders to align teams with sales targets and ensure everyone is working toward common goals.
Frequently Asked Questions (FAQs)
1. What is the Water Sales KPI Dashboard in Excel?
The Water Sales KPI Dashboard in Excel is a template designed to help businesses track and analyze key performance indicators related to water sales. It provides real-time insights into sales volume, revenue, customer retention, and other important metrics.
2. How do I use the Water Sales KPI Dashboard?
Simply enter your sales data into the relevant sheets (Actual, Target, Previous Year) and the dashboard will update automatically. You can view MTD and YTD performance, track KPIs, and identify areas for improvement.
3. Can I customize the KPIs in the dashboard?
Yes, the dashboard is highly customizable. You can add, remove, or modify KPIs to suit your specific business needs.
4. How can I improve my sales performance using this dashboard?
By tracking key KPIs such as sales growth rate, customer retention, and sales conversion, you can identify performance gaps and take corrective actions to improve your sales strategy.
5. Is the Water Sales KPI Dashboard compatible with other Excel versions?
Yes, the dashboard is designed to be compatible with most versions of Excel, making it accessible to a wide range of users.
Conclusion
The Water Sales KPI Dashboard in Excel is a powerful tool for managing and optimizing water sales performance. With its easy-to-use interface, real-time data updates, and comprehensive KPI tracking, this dashboard helps businesses make informed decisions that drive growth and profitability. By following best practices and regularly updating the data, you can ensure that your water sales operations remain on track and aligned with your goals.
Visit our YouTube channel to learn step-by-step video tutorials
Click to buy Water sales KPI Dashboard in Excel