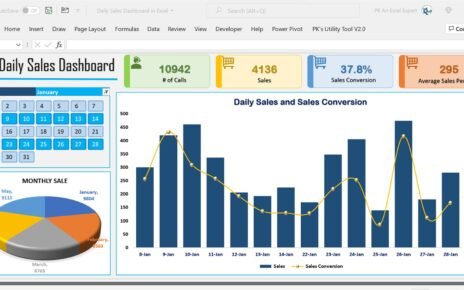
Daily Sales dashboard is quite useful template to track your daily sales. we have created a Daily Sales Dashboard to
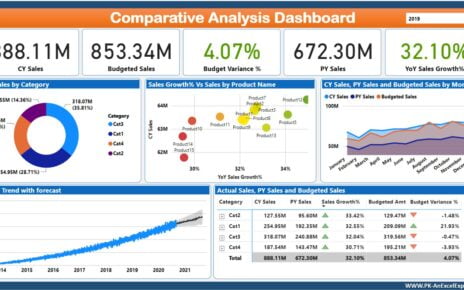
Introduction Comparative Analysis is very important for each business. Using these analysis they can see the insights how they are
A Quarterly Review Calendar is an essential tool for businesses, organizations, and even personal projects to track key events, meetings,