Managing work orders can be a challenging task, especially when handling multiple requests at the same time. However, with a Work Order Dashboard in Excel, you can streamline the entire process, track progress, and make better decisions. This article will walk you through everything you need to know about creating and using a Work Order Dashboard in Excel efficiently.
Click to buy Work Order Dashboard
What is a Work Order Dashboard in Excel?
A Work Order Dashboard in Excel is a centralized tool that helps businesses track and manage work orders with ease. It provides a visual representation of key data, making it simple to monitor ongoing tasks, priorities, costs, and trends. Since Excel is widely used and accessible, this dashboard becomes an efficient way to analyze work orders without needing complex software.
Key Features of the Work Order Dashboard in Excel
To make tracking easier, this dashboard is structured into five main worksheets, each serving a specific purpose:
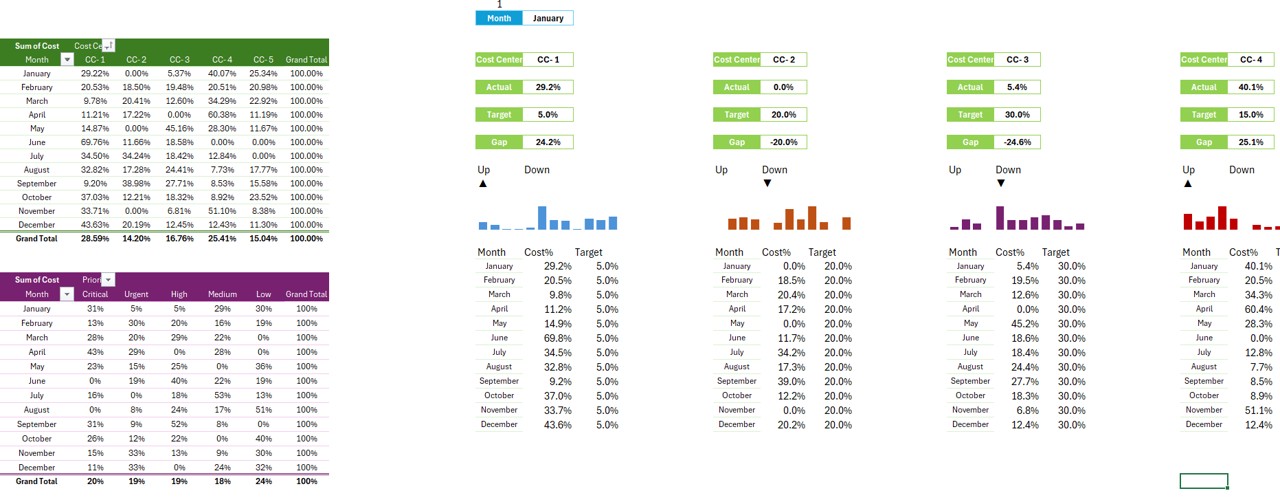
Summary Sheet
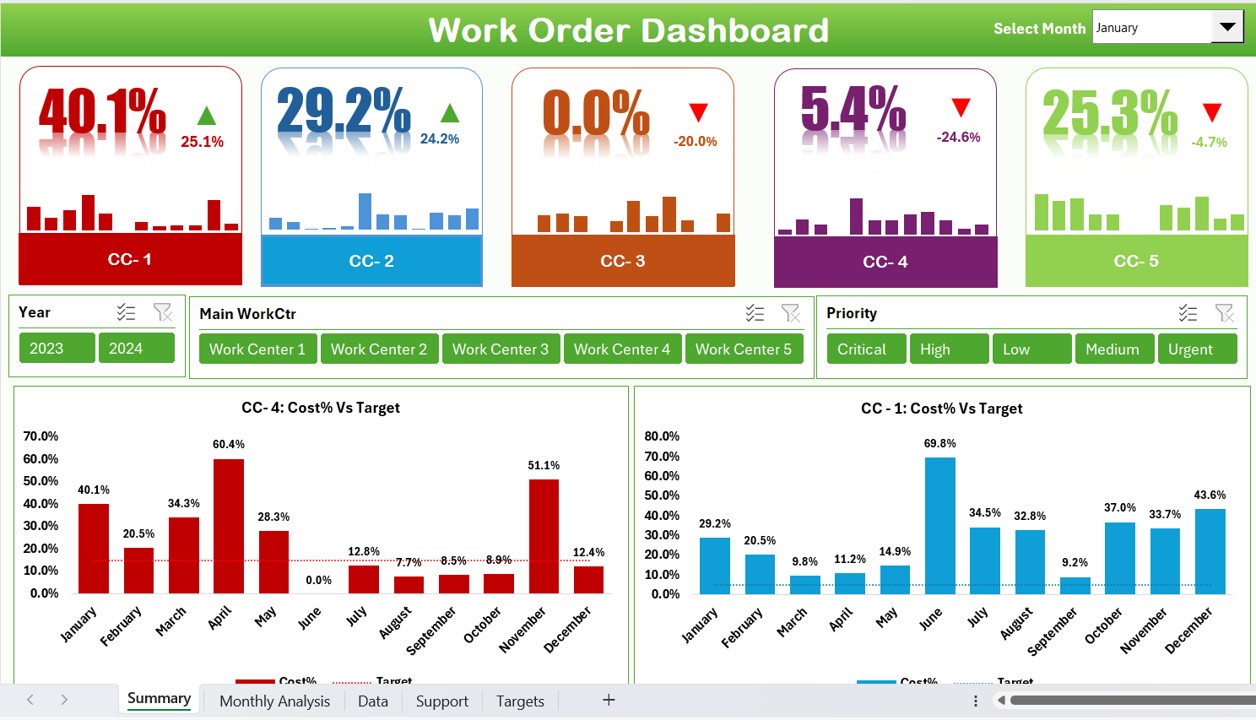
This sheet acts as the main control panel of the dashboard, offering a quick overview of all work orders. Here’s what you’ll find:
- Dropdown for Monthly Selection: Easily switch between different months to analyze trends.
Five Key Performance Cards: A snapshot of crucial metrics.
- Trend Analysis: Understand how work orders change over time.
- Slicers for Quick Filtering: Filter data by Year, Main Work CTR, and Priority to focus on relevant details.
Five Interactive Charts:
- CC-1: Cost % Target Column Chart
- CC-2: Cost % Target Column Chart
- CC-3: Cost % Target Column Chart
- CC-4: Cost % Target Column Chart
- CC-5: Cost % Target Column Chart
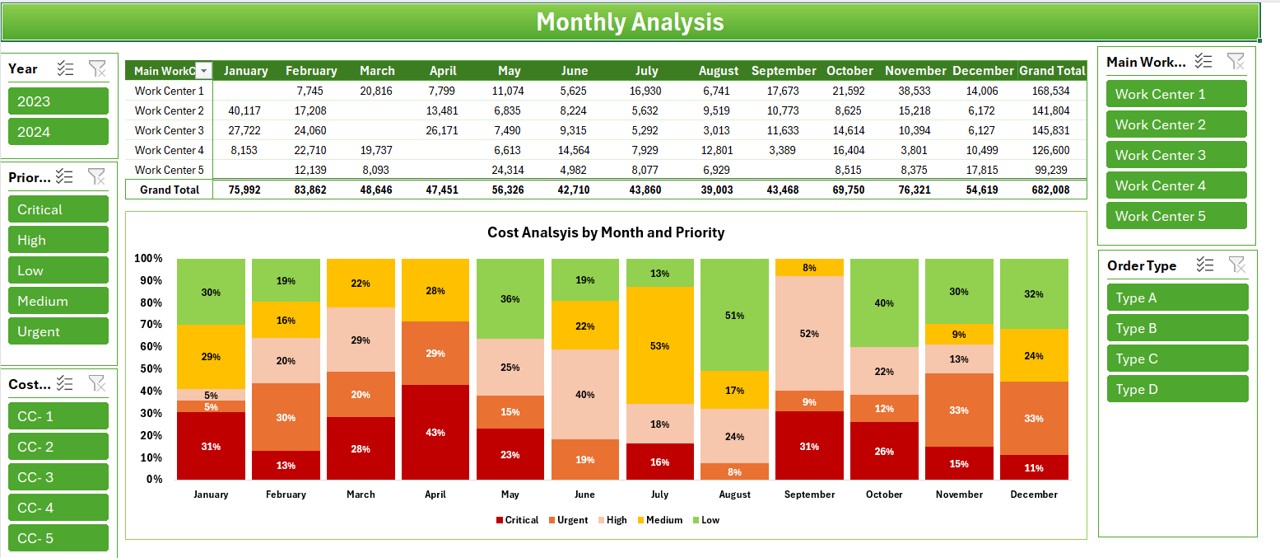
Monthly Analysis Sheet
Click to buy Work Order Dashboard
This sheet provides an in-depth month-wise analysis of work orders. The key highlights include:
- Five Slicers for Filtering: Year, Priority, Cost, Main Work, and Order Type.
- Monthly Breakdown Table: Displays work order data for each month, making it easier to analyze patterns.
- Cost vs. Priority Analysis: Helps in evaluating cost allocation based on priority levels.
Data Sheet
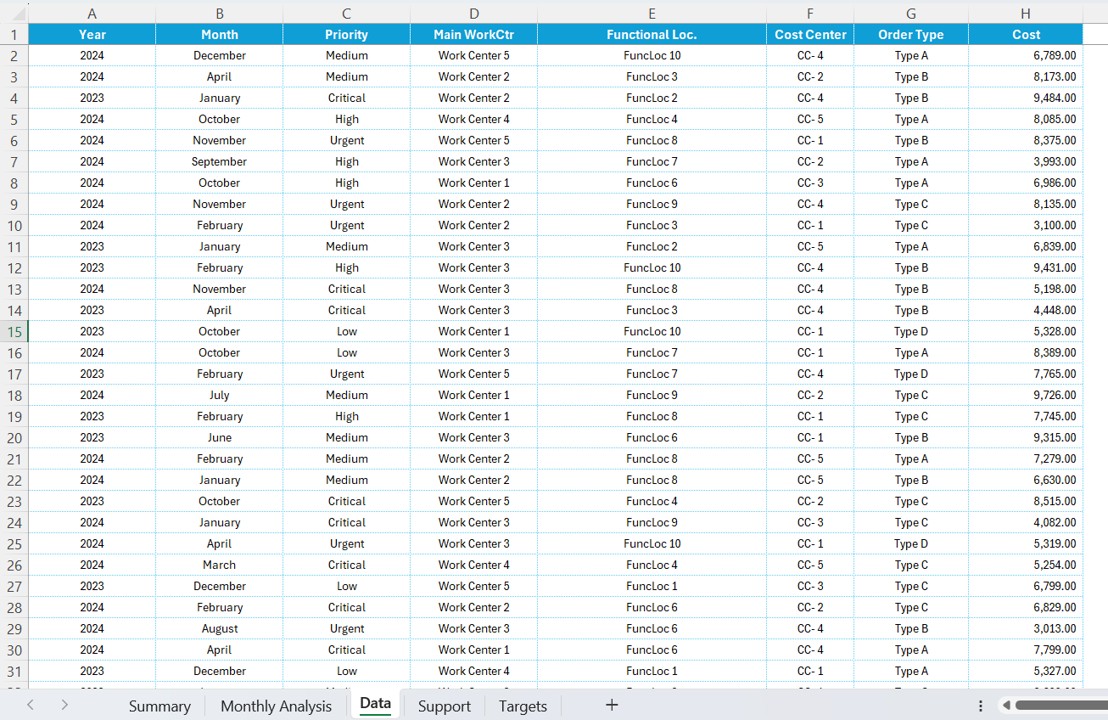
This sheet stores the raw data that powers the entire dashboard. It includes:
- Year
- Month
- Priority
- Main Work Center
- Functional Location
- Cost Center
- Order Type
- Cost
Click to buy Work Order Dashboard
Support Sheet
This sheet is responsible for calculations and formulas that automate the dashboard’s functionality. It’s best to keep this sheet hidden to prevent accidental modifications.
Target Sheet
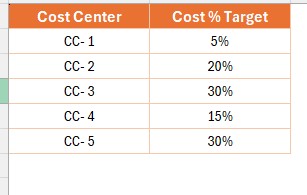
This sheet contains predefined cost percentage targets for different cost centers.
Why Should You Use a Work Order Dashboard in Excel?
Better Visibility of Work Orders
- Provides an easy-to-read summary of work orders and their current status.
- Helps you quickly identify delays and bottlenecks.
Data-Driven Decisions
- Analyze work orders based on cost, priority, and timelines.
- Supports trend analysis for better future planning.
Saves Time and Effort
- Reduces manual tracking by automating calculations.
- Makes cost tracking quick and hassle-free.
Improves Cost Management
- Helps in budget allocation and tracking expenses.
- Avoids unnecessary spending by monitoring cost trends.
User-Friendly Interface
- Designed to be simple and easy to navigate.
- Interactive slicers allow users to filter and analyze data in just a few clicks.
Click to buy Work Order Dashboard
Best Practices for Using the Work Order Dashboard in Excel
- Keep the Data Updated: For accurate analysis, make sure you update the data sheet regularly with new work orders and cost details.
- Use Filters and Slicers Effectively: Instead of manually searching for data, use slicers to filter information quickly and focus on relevant work orders.
- Review the Target Sheet Regularly: Make sure cost targets remain aligned with company goals and adjust them whenever necessary.
- Protect Important Formulas: Since the dashboard relies on formulas, lock or hide formula-based sheets, like the Support Sheet, to prevent accidental changes.
- Customize the Dashboard for Your Business Needs: Modify the dashboard to include additional KPIs, reports, or custom calculations that suit your organization.
Conclusion
A Work Order Dashboard in Excel is a powerful tool that simplifies work order tracking and enhances decision-making. With an easy-to-use interface, automated calculations, and interactive filters, this dashboard makes managing work orders efficient and hassle-free. By following best practices, you can make the most out of this tool and improve your organization’s workflow.
Frequently Asked Questions (FAQs)
Q. How can I customize the Work Order Dashboard?
You can add more filters, charts, or KPIs to match your business needs. Adjusting cost analysis formulas can also improve accuracy.
Q. Can this dashboard be used for different departments?
Yes! You can modify it to track work orders across different teams or departments.
Q. Is it possible to integrate this dashboard with other tools?
Absolutely! You can import data from ERP systems or link it to other reporting tools like Power BI.
Q. How can I ensure data accuracy in this dashboard?
Regularly update the Data Sheet, set realistic targets, and use data validation to reduce errors.
Q. Can I create this dashboard in Power BI instead of Excel?
Yes! If you need more advanced visualizations and real-time updates, Power BI is a great alternative.
Click to buy Work Order Dashboard
Visit our YouTube channel to learn step-by-step video tutorials