In today’s fast-paced business world, balancing workload across teams and departments is more crucial than ever. Uneven task distribution, overwhelmed employees, or under-utilized resources can lead to missed deadlines, low morale, and reduced productivity. That’s where a Workload Balance KPI Dashboard in Excel comes into play.
This comprehensive tool not only visualizes workload metrics but also enables managers to make data-driven decisions to improve team efficiency. In this article, you’ll learn what the dashboard includes, its benefits, best practices, and how to use it effectively.
Click to Workload Balance KPI
What is a Workload Balance KPI Dashboard?
A Workload Balance KPI Dashboard is a dynamic Excel-based template designed to track, measure, and analyze workload distribution using KPIs (Key Performance Indicators). It helps managers:
- Visualize employee performance.
- Ensure equal distribution of work.
- Monitor productivity over time.
- Compare actual performance against targets and past data.
This dashboard comes pre-built in Excel and is fully customizable, making it ideal for HR teams, project managers, and department leads.
Why You Need a Workload Balance Dashboard
Balancing work is not just about fairness—it directly impacts output quality and employee satisfaction. An Excel dashboard offers:
- Real-time insights into workload metrics.
- A visual representation of data for faster decisions.
- Better planning with monthly and yearly performance comparisons.
- Instead of relying on gut feeling, use this tool to make smart, data-backed decisions.
Key Features of the Workload Balance KPI Dashboard
This ready-to-use Excel dashboard consists of 7 interconnected worksheets, each serving a unique purpose. Let’s break them down:
Home Sheet – Your Navigation Center
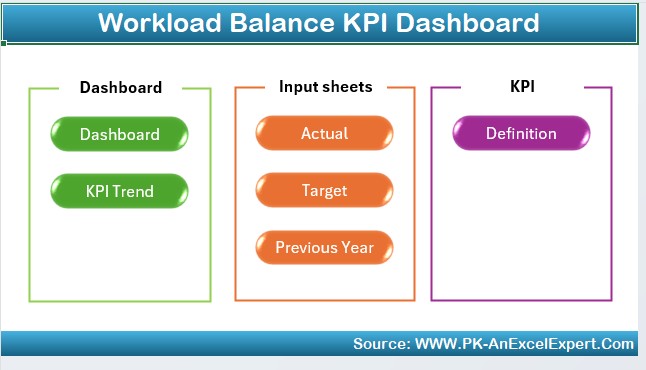
The Home sheet acts as the index for the entire dashboard. It features six clickable buttons, each redirecting you to a specific worksheet with one click. This keeps navigation user-friendly and organized.
Buttons on the Home Sheet include:
- Dashboard
- KPI Trend
- Actual Input
- Target Sheet
- Previous Year Data
- KPI Definition
This saves time and reduces the chances of errors while managing your KPI system.
Click to Workload Balance KPI
Dashboard Sheet Tab – The Heart of the Tool
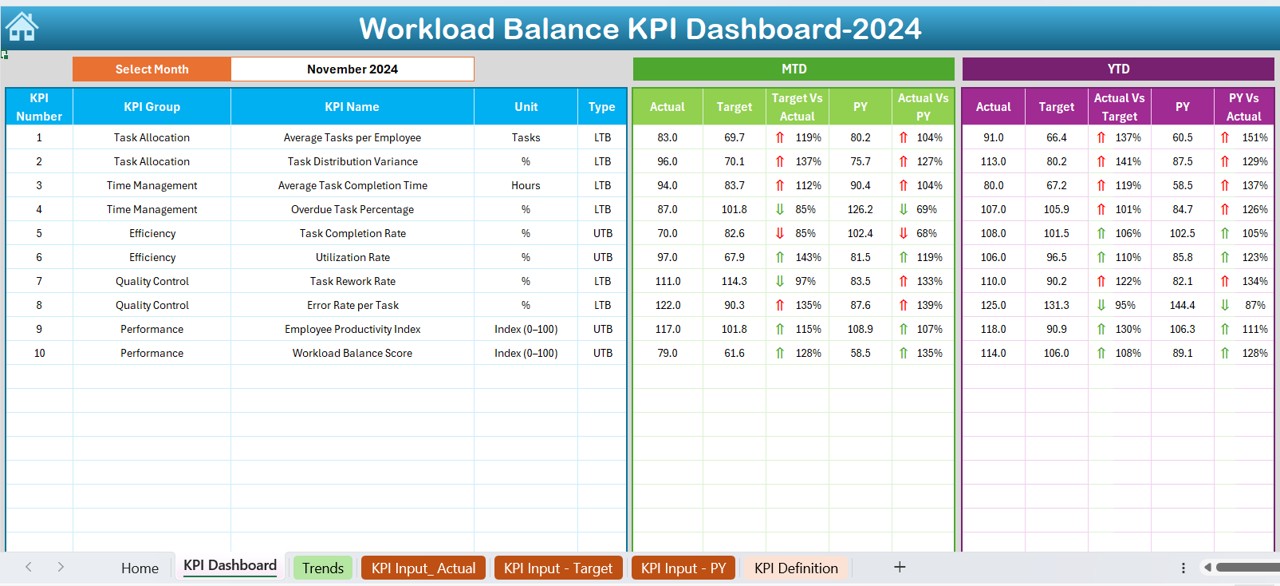
This is where the magic happens. You can select a month from a dropdown in cell D3, and all data across the dashboard will update automatically.
Here’s what you’ll find:
- MTD (Month-to-Date) values: Actual, Target, and Previous Year.
- YTD (Year-to-Date) values: Actual, Target, and Previous Year.
- Variance indicators: Arrows with conditional formatting showing upward or downward trends.
These features make it easy to compare performance and identify gaps instantly.
Click to Workload Balance KPI
KPI Trend Sheet – Dive into the Details
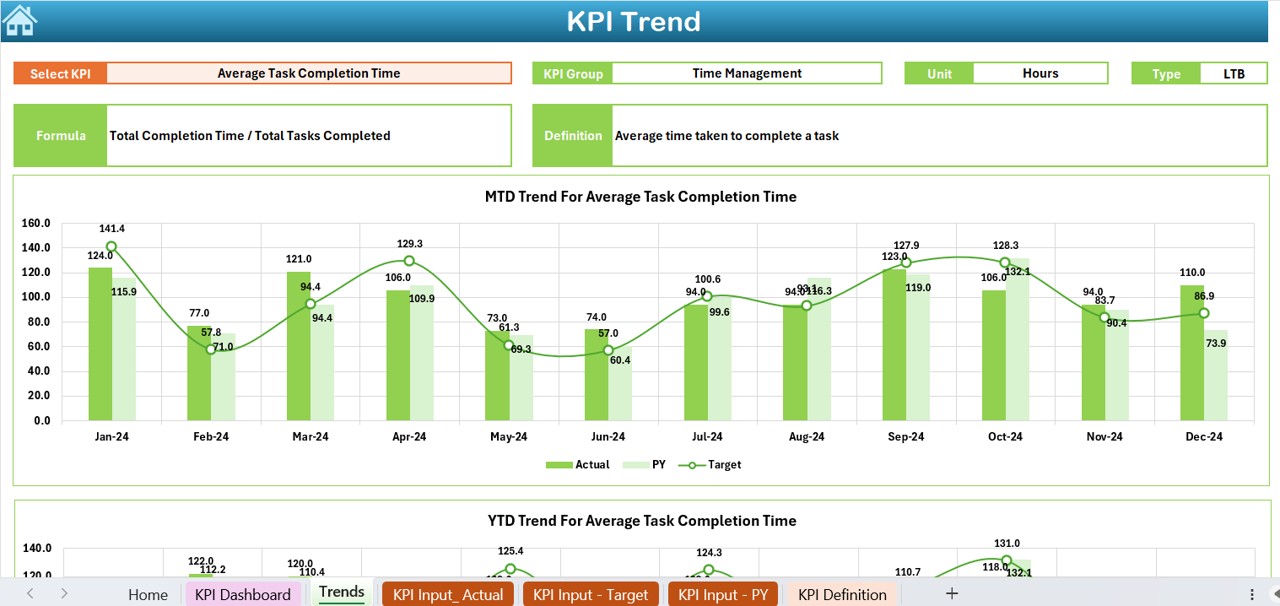
In this tab, select a KPI name from the dropdown in cell C3. The dashboard displays:
- KPI Group
- Unit of measurement
- KPI Type (Upper is better or Lower is better)
- Formula used
- Clear KPI definition
Additionally, you’ll see MTD and YTD trend charts showing Actual, Target, and Previous Year values. This helps you analyze patterns and understand performance over time.
Actual Numbers Input Sheet – Data Entry Made Simple
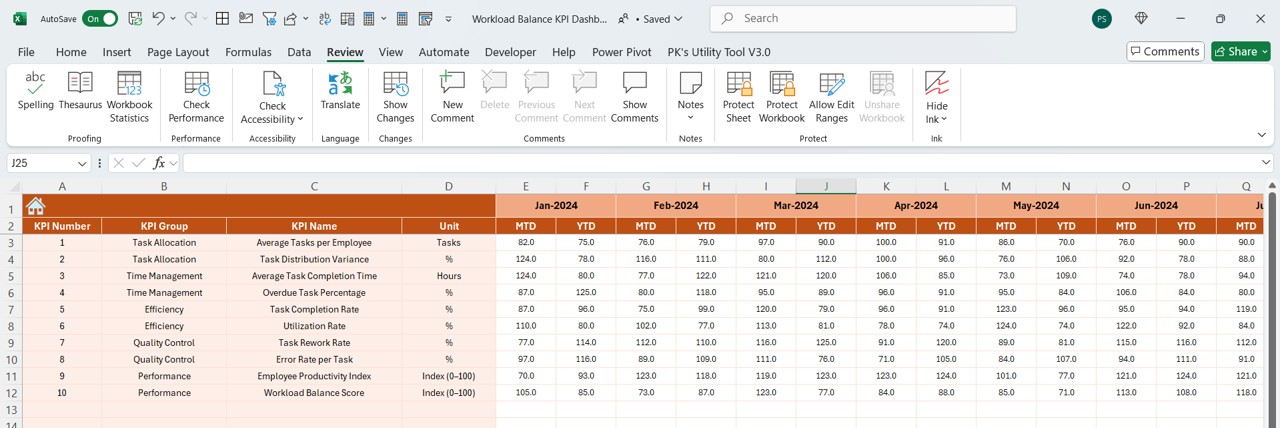
Use this sheet to input actual performance numbers for each month. In cell E1, select the starting month of the year. Based on that, the sheet dynamically adjusts to accept:
- Month-wise MTD values
- Corresponding YTD values
All numbers feed directly into the dashboard and trend charts. This eliminates manual recalculations.
Target Sheet Tab – Set Your Benchmarks
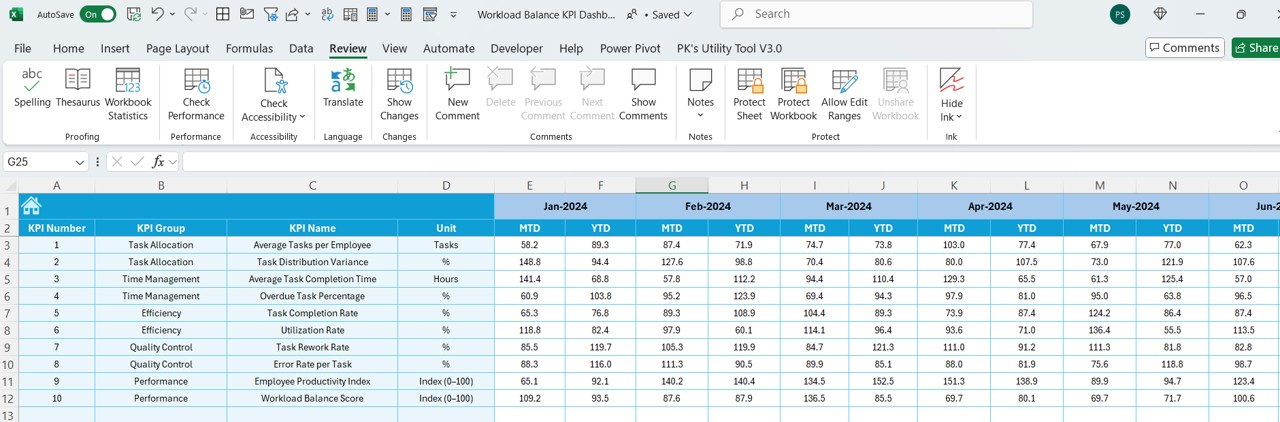
In this tab, enter monthly target numbers for each KPI, including both MTD and YTD. These targets form the benchmark against which actual numbers are measured.
Why this matters: Without benchmarks, you cannot evaluate success. This tab ensures that every KPI is aligned with organizational goals.
Click to Workload Balance KPI
Previous Year Number Sheet – Historical Context
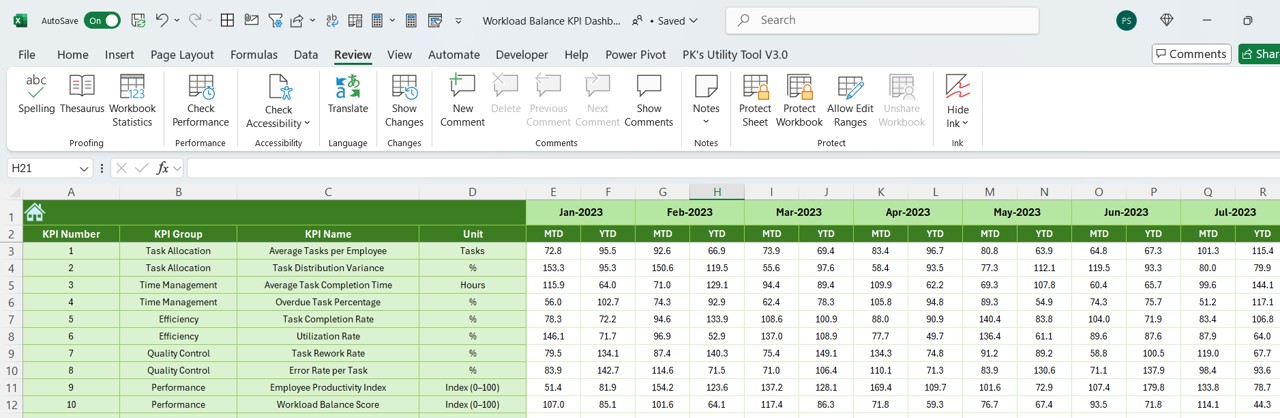
Use this sheet to input previous year’s data, formatted just like the actual and target sheets. Having historical numbers allows you to:
- Measure growth or decline
- Recognize seasonal trends
- Set more realistic goals
With year-over-year comparison built into the dashboard, you get a clearer picture of progress.
KPI Definition Sheet – Standardize Everything
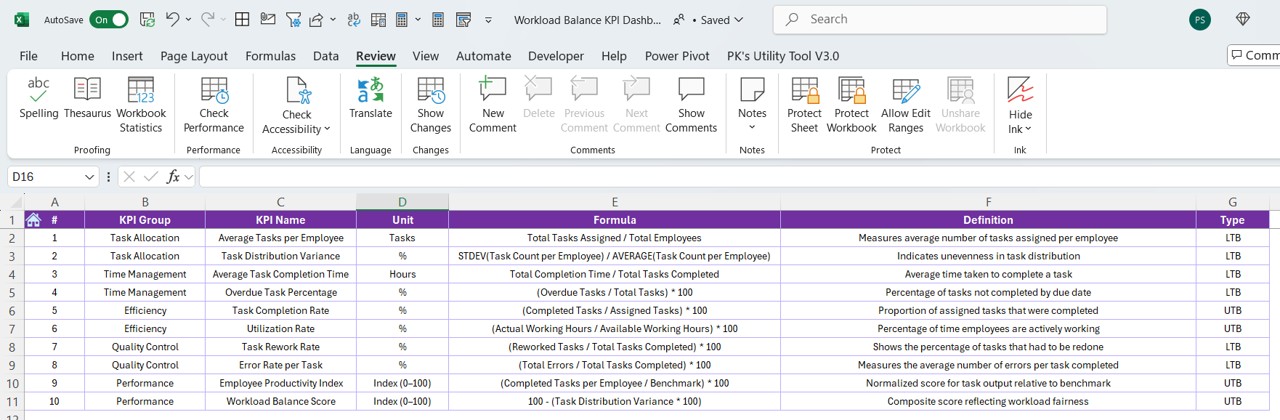
Clarity is key when managing KPIs. In this sheet, enter:
- KPI Name
- KPI Group
- Measurement Unit
- KPI Formula
- Easy-to-understand definition
This sheet ensures everyone in your team speaks the same language when discussing KPIs.
Advantages of Using a Workload Balance KPI Dashboard in Excel
Here are some strong reasons why this Excel template is a must-have:
📊 Centralized Data Management: All your actuals, targets, and trends live in one file—no more juggling multiple spreadsheets.
📈 Visual Trend Analysis: Conditional formatting and dynamic charts help you instantly spot whether performance is improving or declining.
⏱️ Real-Time Decision Making: With dropdowns and auto-calculated formulas, you can analyze data instantly, saving tons of time.
🔁 Monthly & Yearly Comparisons: Get a snapshot of the current performance and how it stacks against targets and last year’s numbers.
💡 Clarity on KPI Definitions: Everyone on the team will understand what each KPI means and how it’s measured.
Click to Workload Balance KPI
Best Practices for Using the Workload Balance KPI Dashboard
To get the most out of this Excel dashboard, follow these tried-and-tested tips:
✅ Keep Your Data Updated: Make sure to enter actual, target, and previous year data consistently every month.
✅ Define Clear KPIs: Use the KPI Definition Sheet to write easy-to-understand definitions so that there’s no confusion across departments.
✅ Review Monthly: Set a calendar reminder to review the dashboard at the beginning of each month. This ensures performance tracking remains a continuous process.
✅ Customize As Needed: While the template is ready to use, feel free to add your own KPIs, colors, or logos to make it more personalized.
✅ Use Conditional Formatting: Highlight important metrics using arrows, color scales, or data bars to improve readability.
Conclusion
The Workload Balance KPI Dashboard in Excel is a practical, plug-and-play solution for tracking performance, monitoring employee workload, and improving team efficiency. With features like auto-updating charts, variance indicators, and structured KPI definitions, it becomes a one-stop tool for balanced work distribution.
Whether you’re a team leader, HR professional, or project manager, this dashboard helps you make faster, smarter, and more confident decisions.
Frequently Asked Questions (FAQs)
❓What is the main purpose of a Workload Balance KPI Dashboard?
The main purpose is to monitor how work is distributed across a team and ensure it aligns with organizational targets. It helps spot inefficiencies and take corrective actions.
❓Can I customize the KPIs in this Excel dashboard?
Yes, the dashboard is fully editable. You can add, remove, or modify KPIs as per your business requirements using the KPI Definition sheet.
❓Is this dashboard suitable for large teams?
Absolutely. Whether you have 5 employees or 500, the dashboard works by aggregating KPIs, making it suitable for teams of any size.
❓How often should I update the actual numbers?
It’s best to update the actual data monthly. This keeps your MTD and YTD calculations accurate and meaningful.
❓Can I use this dashboard without Excel expertise?
Yes, it’s beginner friendly. The built-in dropdowns, instructions, and automated calculations make it easy to use, even if you’re not an Excel expert.
Click to Workload Balance KPI
Visit our YouTube channel to learn step-by-step video tutorials