Workplace safety is a crucial aspect of any organization. Monitoring safety KPIs (Key Performance Indicators) helps businesses track incidents, compliance, and overall safety performance. With an Excel-based Workplace Safety KPI Dashboard, you can efficiently manage and analyze safety metrics in real-time.
This article will guide you through the features, advantages, and best practices for using a Workplace Safety KPI Dashboard in Excel.
Click to Workplace Safety KPI
What is a Workplace Safety KPI Dashboard?
A Workplace Safety KPI Dashboard is a tool that helps businesses track safety performance using key metrics. It consolidates important data into a visual and interactive format, allowing organizations to monitor incidents, compliance, and safety measures effectively.
This ready-to-use Workplace Safety KPI Dashboard in Excel consists of seven sheets, each serving a specific purpose to ensure seamless data entry, analysis, and visualization.
Key Features of the Workplace Safety KPI Dashboard
Click to Workplace Safety KPI
This dashboard includes seven essential worksheets:
Home Sheet
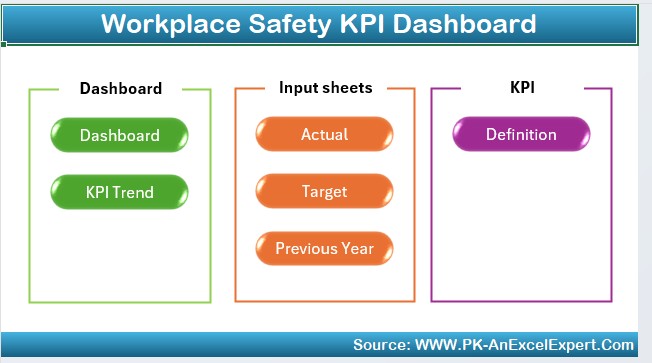
- Serves as an index page.
- Includes six buttons for easy navigation to other sheets.
Dashboard Sheet
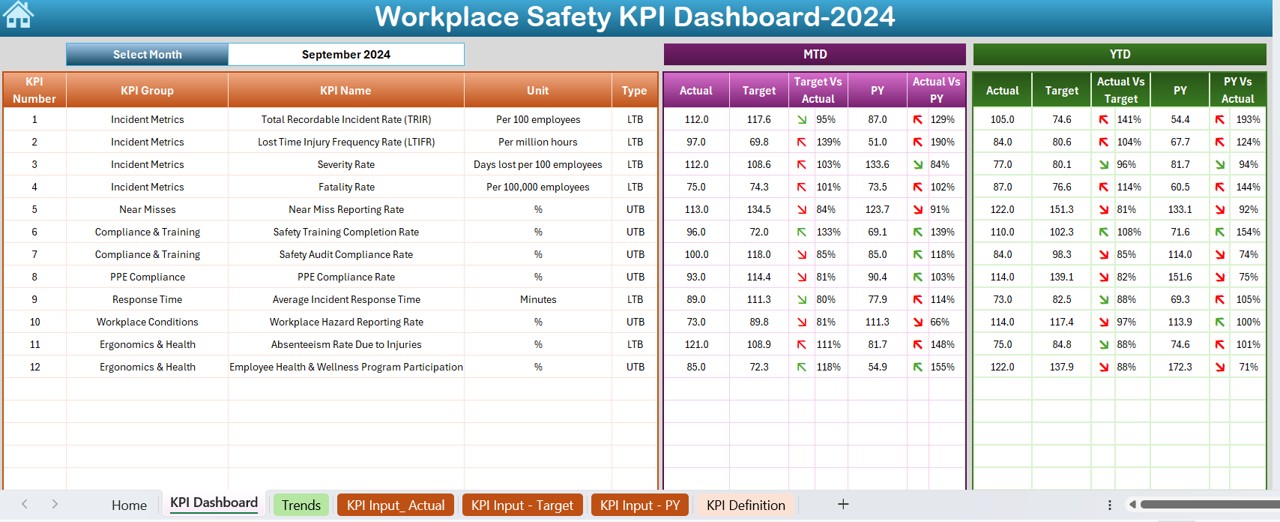
- Displays all KPI-related data in an interactive dashboard.
- Users can select the month from a drop-down menu (cell D3) to view relevant statistics.
- Shows MTD (Month-to-Date) and YTD (Year-to-Date) Actuals, Targets, and Previous Year Data.
- Uses Conditional Formatting with Up/Down Arrows for quick comparisons of performance.
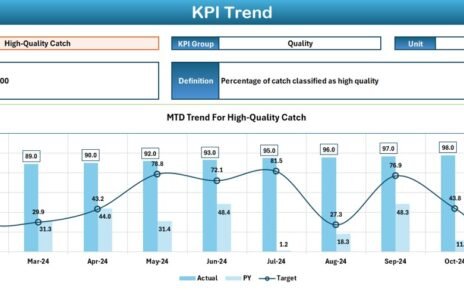
KPI Trend Sheet
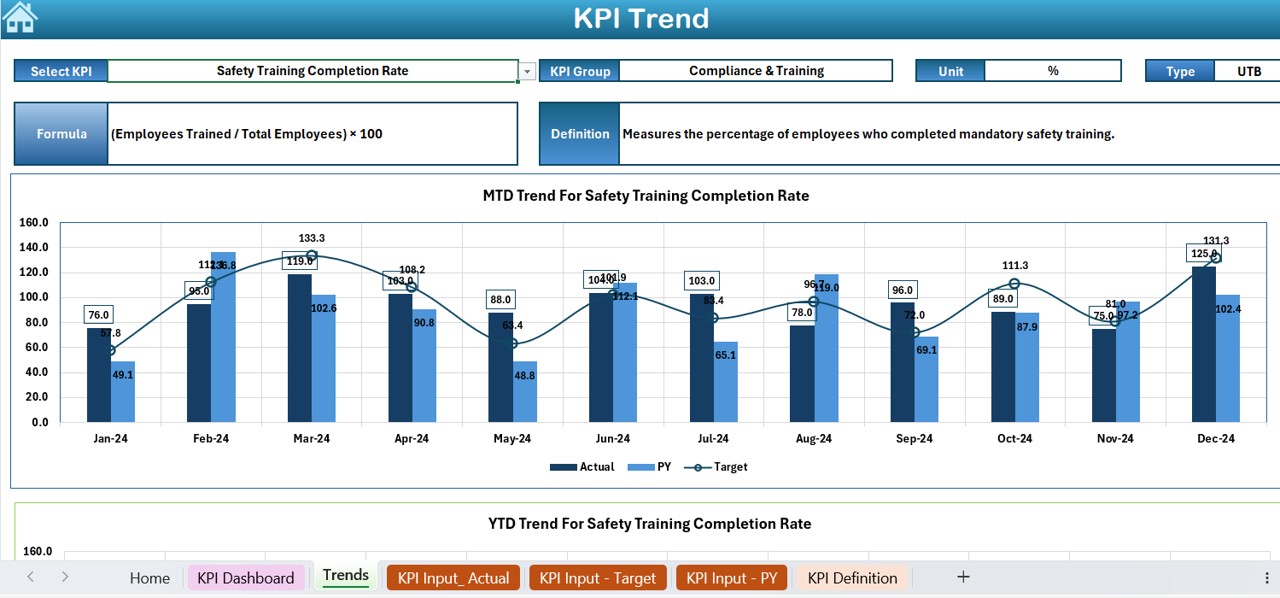
- Users can select any KPI from a drop-down list (cell C3).
- Displays KPI details such as Group, Unit, Type (Lower or Upper is Better), Formula, and Definition.
- Includes trend charts for MTD and YTD Actual, Target, and Previous Year numbers.
Click to Workplace Safety KPI
Actual Numbers Input Sheet
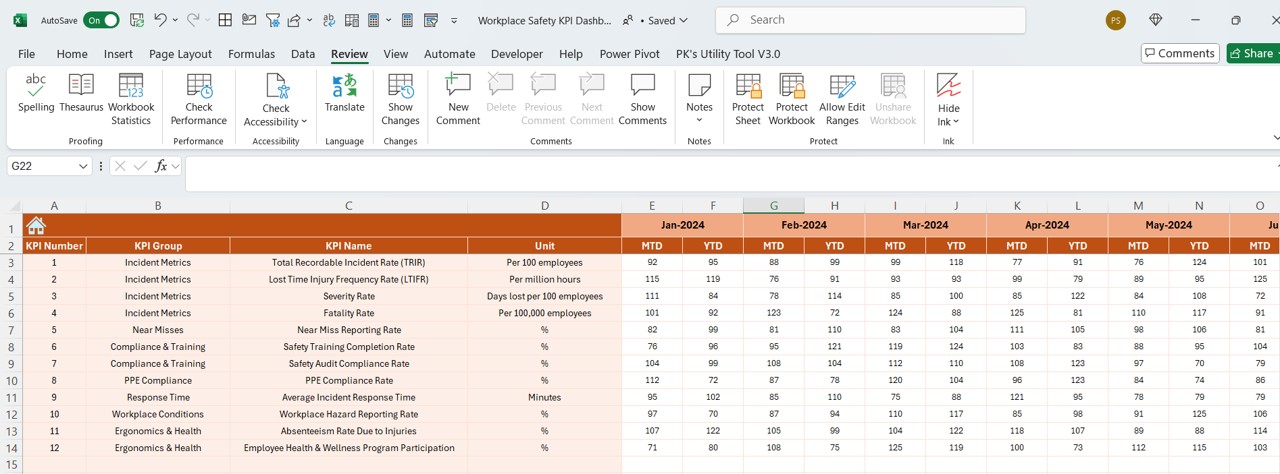
- Users must input actual KPI numbers for MTD and YTD.
- Month selection is available at cell E1.
- The dashboard updates automatically when values are entered.
Target Sheet
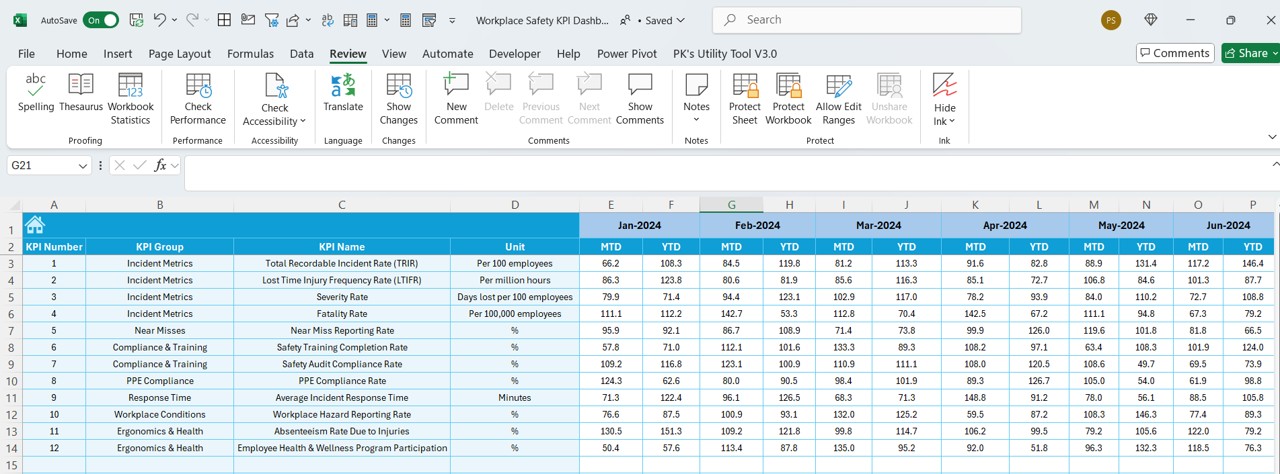
- Users enter the target values for each KPI per month.
- Supports both MTD and YTD targets.
Previous Year Numbers Sheet
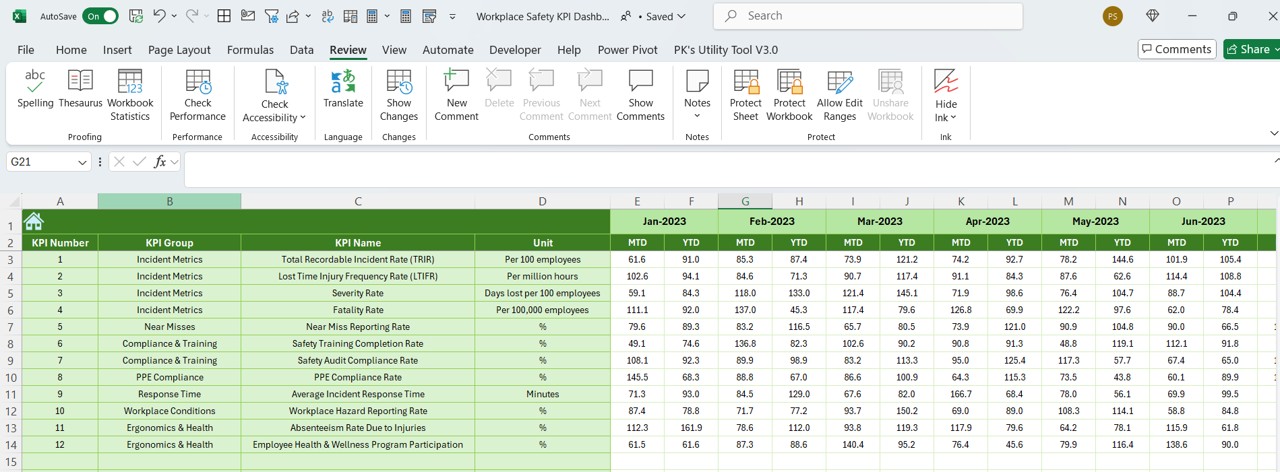
- Allows entry of previous year KPI values.
- Helps track performance trends over time.
Click to Workplace Safety KPI
KPI Definition Sheet
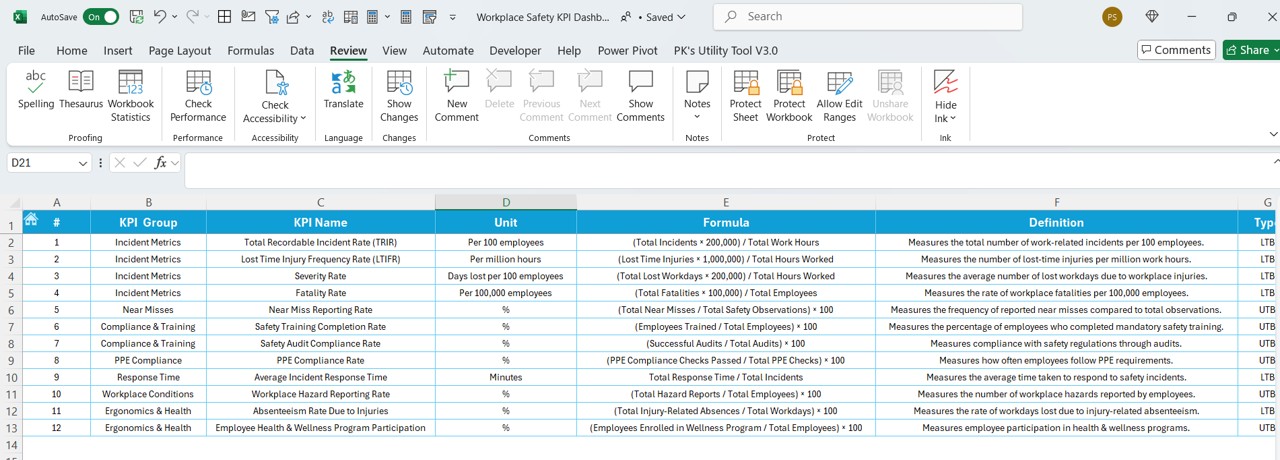
- Includes a detailed explanation of each KPI.
- Fields include KPI Name, Group, Unit, Formula, and Definition.
Advantages of Using the Workplace Safety KPI Dashboard
- Centralized Data Management: All workplace safety KPIs are stored in one file, making it easy to track and analyze.
- Automated Reporting: The dashboard updates dynamically, eliminating manual calculations.
- Interactive Data Visualization: Features charts, conditional formatting, and drop-downs to enhance decision-making.
- Customizable & Scalable: Users can modify KPIs, formulas, and target values to fit specific organizational needs.
- Improved Compliance & Risk Management: Helps track safety violations and ensure compliance with workplace safety regulations.
Best Practices for Using the Workplace Safety KPI Dashboard
- Define Clear KPI Goals: Identify critical workplace safety KPIs that align with company objectives.
- Ensure Accurate Data Entry: Regularly update actual, target, and previous year data for precise analysis.
- Monitor Trends Consistently: Use the KPI Trend Sheet to spot patterns and take proactive measures.
- Use Conditional Formatting Effectively: The built-in up/down arrows help identify deviations from the target.
- Conduct Regular Reviews: Schedule weekly or monthly reviews to ensure compliance and workplace safety improvements.
- Modify and Expand When Necessary: Adapt the dashboard to include new safety KPIs or regulatory requirements as needed.
Conclusion
Click to Workplace Safety KPI
A Workplace Safety KPI Dashboard in Excel provides a structured and efficient way to monitor workplace safety metrics. With its interactive charts, automated calculations, and trend analysis, organizations can improve safety standards, reduce risks, and enhance overall compliance.
Frequently Asked Questions (FAQs)
What are the essential KPIs for workplace safety?
- Some key workplace safety KPIs include:
- Total Recordable Incident Rate (TRIR)
- Lost Time Injury Frequency Rate (LTIFR)
- Near Miss Incidents
- Safety Training Compliance
- Workplace Inspection Scores
Can I customize the Workplace Safety KPI Dashboard in Excel?
- Yes! The dashboard is fully customizable. You can:
- Add or modify KPIs.
- Change target values and formulas.
- Modify charts and data visualization.
How often should I update the safety KPI data?
- For the best results, update the Actual Numbers Input Sheet monthly. If you monitor high-risk industries, weekly updates may be necessary.
Does this dashboard require advanced Excel knowledge?
- No, this dashboard is designed to be user-friendly. Basic Excel knowledge is enough to navigate and update data.
How does this dashboard help improve workplace safety?
- By providing real-time tracking and analysis, the dashboard:
- Identifies safety trends and patterns.
- Highlights areas needing improvement.
- Ensures compliance with safety standards.
Can this dashboard be used for multiple locations?
Yes, the dashboard can be modified to track multiple locations by adding location filters or separate sheets for each site.
Click to Workplace Safety KPI
Visit our YouTube channel to learn step-by-step video tutorials
View this post on Instagram